
Application Note
Development of a platelet calcium flux assay using Fura-2, AM on the FlexStation 3 reader
- Real-time kinetic measurement of intracellular Ca2+ changes in platelets provides informationrich data
- Ability to miniaturize assay from cuvettes to ½ area well plates decreases platelet and compound usage
- On-board pipettor improves well-to-well reproducibility and assay robustness on FlexStation 3 reader
Introduction
Platelets are small, anucleate blood cells that mediate haemostasis by aggregating at sites of blood vessel injury to form a thrombus (or clot) that limits blood loss. When platelets respond to vessel damage inappropriately this can lead to thrombotic disease such as heart attacks and ischaemic stroke. Three main steps underlie thrombus formation: stage one is adhesion (platelets attach to exposed matrix proteins in the damaged vascular endothelium), stage two is activation (receptor mediated events such as shape change and secretion of chemical messengers), and stage three is aggregation (platelet-to-platelet adhesion). During platelet adhesion, platelets are initially activated by collagen via the glycoprotein VI receptor (GPVI), and then by a variety of secreted agonists such as adenosine diphosphate (ADP) and thromboxane A2 (TxA2), which activate G-protein coupled receptors (GPCRs). These receptors couple to one of two phospholipase C (PLC) isoforms expressed in platelets, PLCß or PLCγ2, and subsequently calcium (Ca2+) is released into the cytosol from the dense tubular system (DTS). Depletion of Ca2+ from the DTS triggers an influx of extracellular Ca2+ via a mechanism known as store-operated Ca2+ entry. Elevation of cytosolic Ca2+ via these mechanisms underpins all aspects of platelet function, including adhesion, shape change, and aggregation. Understanding how different agonists modulate this critical regulator of platelet function in health and disease will guide development of novel, safe anti-thrombotic drugs.
Here, we show how it is feasible to easily measure Ca2+ flux in human platelets, a primary human tissue, in a microplate format using the high affinity, fluorescent calcium indicator Fura-2, AM. We demonstrate that miniaturizing the assay in 96-well half area microplates, and using the flexible liquid transfer features of the FlexStation® 3 Multi-Mode Microplate Reader allows rapid and reliable measurement of EC50 values for agonists and IC50 values for antagonists.
Methods
Platelet preparation
Collect 50 mL of blood from a healthy, consenting donor (in accordance with local ethics) into a syringe containing 4% sodium citrate (0.32% final), add 7.5 mL of acid citrate dextrose (110 mM glucose, 80 mM citric acid, 120 mM sodium citrate) per 50 mL of whole blood. Then centrifuge the tube at 100 g for 20 min. and remove the platelet rich plasma (PRP) with a Pasteur pipette. Count the platelets. Next add Fura-2, AM to a final concentration of 2 µM, mix gently by inverting the tube and incubate at 30°C for 60 minutes in the dark, inverting the tube every 15 minutes. Finally, centrifuge the PRP at 350 g for 20 minutes and resuspend the platelet pellet in Tyrode’s solution at \~ 4 x 10⁸ platelets/mL. Allow the platelets to stand for 15 minutes (Figure 1).
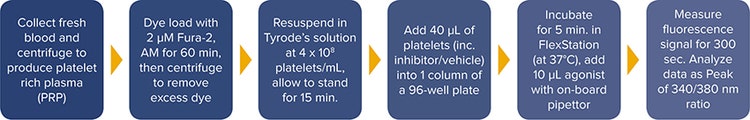
Figure 1. FlexStation 3 reader platelet Ca2+ assay workflow using Fura-2, AM on the FlexStation 3 reader
Calcium flux measurement
Add 40 µL of platelet suspension (including inhibitor or vehicle at final concentration) into each well of a single column of a black wall, clear-bottom, half-area 96-well plate. Incubate for 5 minutes in the FlexStation 3 reader (set to 37°C) before acquiring data.
Measure the baseline fluorescence signal detected at 510 nm emission with excitation at 340 nm and 380 nm. Using the on-board pipettor, add 10 µL of 5X agonist after 15 seconds, and then monitor the signal for a further 285 sec. (Figure 2).
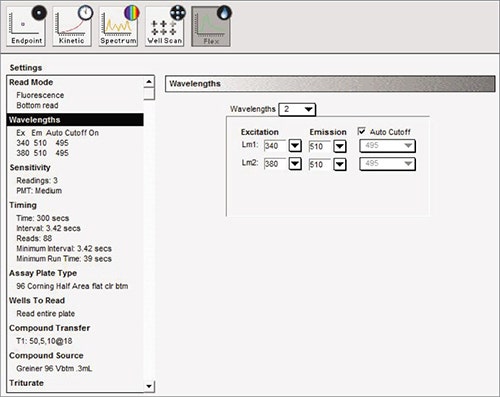
Figure 2. Suggested software settings in SoftMax® Pro Data Acquisition and Analysis Software.
Results
Measurement of agonist EC50 values
Initial experiments were carried out to obtain concentration-response curves to three known agonists of platelet GPCRs, and to calculate EC80 values for the ensuing antagonist studies. The ligands chosen were ADP, U46619 and crosslinked collagen-related peptide (CRP-XL), which act at purinergic P2Y1 receptors, prostanoid TP receptors, and GPVI receptors respectively. Agonist addition caused a rapid increase in cytosolic Ca2+ and resultant changes in both the 340 nm and 380 nm signals when detected with 510 nm emission (Figure 3).
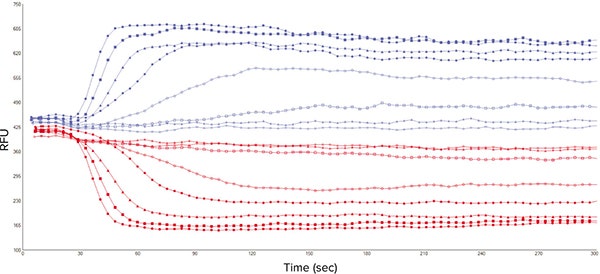
Figure 3. Representative 340 nm and 380 nm fluorescence signal traces from 8 wells of a 96-well microplate. Signal obtained on the FlexStation 3 from Fura-2, AM-loaded platelets stimulated with CRP-XL (7 different concentrations plus vehicle control).
Figure 4 shows the resultant analysis of the 340/380 ratio data in SoftMax Pro Software, yielding EC50 values that were consistent with previous in-house and literature values, as well as column-tocolumn and day-to-day values (Table 1).
Mean EC
50
Table 1. Summary of E/[A] curve analyses shown in Figure 4. The assay Z’-factor is a statistical attempt to quantify the robustness of an assay. A Z-factor between 0.5 and 1.0 indicates an excellent assay, between 0 and 0.5 the assay is considered marginal.
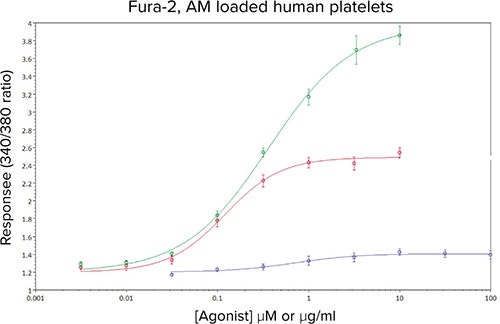
Figure 4. Concentration-response curves to ADP (•), U46619 (•) and CRP-XL (•) in Fura-2, AM-loaded human platelets. Data are mean values ± sem, n ≥ 10 from 5 independent experiments.
The reproducibility of the responses, and the magnitude of the fluorescence signals produced assay Z’ factors for U46619 and CRP-XL that indicated the assay was suitable for the subsequent determination of IC50 values.
Measurement of antagonist IC50 values
The individual agonist EC80 concentrations were determined each day for the antagonist IC50 studies. Provided the EC50/ 80 values were within acceptable limits, the inhibitors were incubated with the Fura-2, AM-loaded platelets during the 5-minute equilibration step inside the FlexStation 3 reader. Because of the smaller assay window we encountered with ADP, it was decided that inhibition curves would only be constructed for TP receptors (with U46619) and GPVI receptors (with CRP-XL). For the TP receptor we chose to use the thromboxane A2 receptor antagonist GR32191B, for the GPVI receptor we elected to use two recently described inhibitors that target different kinases downstream of the GPVI receptor.
In the presence of increasing concentrations of the prostanoid TP receptor antagonist GR32191B, a concentration-dependent decrease in the Ca2+ response to an EC80 challenge of U46619 was observed (Figure 5). The calculated IC50 of 5 nM compared well with previous values obtained in a cuvette based Ca2+ assay (data not shown).
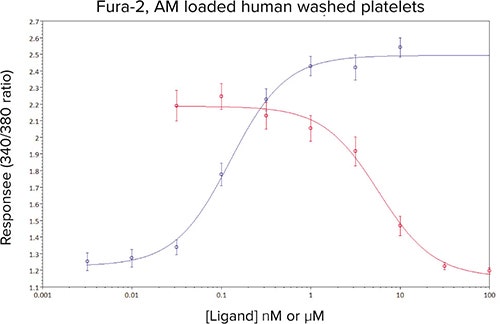
Figure 5. Mean concentration-effect curves for U46619 (•), and U46619 (EC80 concentration) in the presence of 8 different concentrations of GR32181B (•). Data are mean values ± sem, n ≥ 10 from five independent experiments.
In Figure 6, the effect of two recently described, novel tyrosine kinase inhibitors on responses to CRP-XL can be seen, both compounds act downstream of the GPVI receptor with sub-micromolar potencies. The concentration-response curve to CRPXL has been included for clarity. Under these assay conditions the IC50 estimates for inhibitor #1 (red line) and inhibitor #2 (green line) were calculated as 0.15 µM and 0.16 µM respectively.
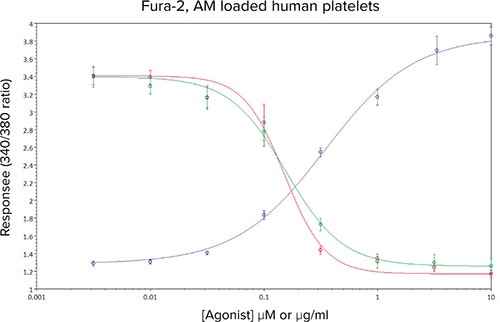
Figure 6. Mean concentration-effect curves for CRP-XL (•), and CRP-XL (EC80 concentration) in the presence of 8 different concentrations of kinase inhibitor #1 (•) and kinase inhibitor #2 (•). Data are mean values ± sem, n ≥ 10 from five independent experiments.
The calculated IC50 values from this assay compared favorably with previous data obtained in a lower throughput microplate based Ca2+ assay (data not shown).
Conclusion
Intracellular Ca2+ is a master regulator of platelet function and has a critical role in thrombotic disease, but can be difficult to measure in fragile human platelet. The FlexStation 3 reader assay described here enables accurate and rapid measurements of agonist EC50 and antagonist IC50 estimates, and could support medium throughput screening of novel drugs using this primary human tissue.
Acknowledgements
Alexander P. Bye & Jonathan M. Gibbins: University of Reading Simon Lydford: Molecular Devices (UK) Ltd.
Learn more about FlexStation 3 Multi-Mode Microplate Reader >>