
Application Note
Measure oxidative metabolism and glycolytic activity on the SpectraMax i3x reader
- Real-time measurement of extracellular oxygen depletion and acidification in cultured cells and microorganisms
- Sensitive TRF detection of two simple, mix-and-measure assay workflows
- Faster data acquisition and analysis with preconfigured SoftMax Pro protocols
Introduction
Cathleen Salomo | Applications Scientist | Molecular Devices GmbH
Ryan McGarrigle, PhD | Research Scientist | Agilent Technologies Ireland Ltd.
Conn Carey, MSc | Technology Specialist | Agilent Technologies Ireland Ltd.
To survive, cells require fuel in the form of ATP to carry out most essential bioprocesses. This fuel is generated through glycolysis and mitochondrial respiration. While both produce ATP, glycolysis can function in the absence of oxygen, whereas mitochondria require oxygen for the final step in oxidative phosphorylation (OXPHOS). These pathways dynamically shift to meet energy demands of the cells while adapting to environmental stresses, substrate availability, and hypoxia. Generally, measurements of changes give more information about metabolic responses than a single point measurement (e.g. ATP endpoint). Perturbed respiration is a sensitive indicator of mitochondrial dysfunction following drug toxicity. Aberrant mitochondrial function has been implicated in a growing spectrum of diseases, from neurodegeneration to cancer.
Understanding how these pathways respond to effector compounds can provide useful insights into the overall function of cells and the underlying mechanisms that determine cell fate.
Recent advances in reagent and plate reader technology now facilitate convenient metabolic analysis on standard microtiter plates. Here, we describe the use of both the Agilent MitoXpress® Xtra Oxygen Consumption Assay and the Agilent pH-Xtra™ Glycolysis Assay on the SpectraMax® i3x Multi-Mode Microplate Reader. An enzymatic assay with glucose oxidase (GOx) and a cell-based assay were used to evaluate oxygen consumption and glycolysis using standard 96-well plates.
The MitoXpress Xtra Oxygen Consumption Assay allows direct real-time measurement of oxygen consumption. The reagent is an oxygen-sensitive, water-soluble, cell-impermeable fluorescent probe. Fluorescence emission is quenched by O2 such that the signal is inversely proportional to the concentration of O2 in the well. As oxygen is consumed, fluorescence increases, so that using kinetic measurements, the user can infer how active the mitochondria are by monitoring the rate of signal increase.
The pH-Xtra Glycolysis Assay allows direct real-time kinetic analysis of extracellular acidification. As glucose is processed by the glycolytic pathway, it can generate pyruvate for further oxidation in the Krebs cycle or generate lactate (lactic acid), which causes the cells to acidify the extracellular environment. This change in pH can be measured using pH-Xtra, providing insight into glycolytic activity. As with MitoXpress Xtra, pH-Xtra exhibits a positive signal response across the biological range, allowing flexible, high-throughput assessment of extracellular acidification, and is not consumed during the reaction. Rates of extracellular acidification are calculated from changes in fluorescence signal over time.
To achieve best sensitivity for MitoXpress Xtra or pH-Xtra reagents it is recommended to use a time-resolved fluorescence detection mode on a plate reader. The SpectraMax i3x reader includes absorbance, fluorescence, and luminescence detection modes. Time-resolved fluorescence detection of the MitoXpress Xtra and pH-Xtra reagents is enabled by the addition of the Time-Resolved (TRF) Detection Cartridge. The TRF detection cartridge contains a dedicated light source and emission filters to achieve a high level of performance. Both acquiring and analyzing the progression of oxygen consumption and glycolic activity is achieved by using a preconfigured protocol available at softmaxpro.org for SoftMax® Pro Software 7.0.3 or higher.
Materials
- HepG2 cells (ATCC cat. #HB-8065)
- Glucose Oxidase from Aspergillus niger – Type IV (Sigma-Aldrich cat. #G2133)
- Complete growth media
- Dulbecco’s Modified Eagle Medium – high glucose (DMEM, Sigma-Aldrich cat. #D5796)
- Fetal bovine serum (Sigma-Aldrich cat. #F2442)
- Penicillin/streptomycin (Sigma-Aldrich cat. #P4333)
- Test compounds
- Antimycin A (Sigma-Aldrich cat. #A8674)
- Carbonyl cyanide 4-(trifluoromethoxy) phenylhydrazone (FCCP, Sigma-Aldrich cat.#C2920)
- 2-Deoxy-D-glucose (2-DG, Sigma-Aldrich cat. #D8375)
- Oligomycin A (Sigma-Aldrich cat. #75351)
- MitoXpress Xtra Oxygen Consumption Assay (Agilent Technologies cat. #MX-200-4), containing:
- MitoXpress Xtra reagent
- High sensitivity oil
- pH-Xtra Glycolysis Assay (Agilent Technologies cat. #PH-200-4), containing:
- pH-Xtra reagent
- Respiration buffer tablet
- Microplates
- 96-well, clear-bottom, tissue-culture treated microplate (Sarstedt cat. #83.3924.300)
- SpectraMax i3x Multi-Mode Microplate Reader (Molecular Devices, cat. #i3x) with TRF Detection Cartridge (Molecular Devices cat. #0200-7008)
Methods
Signal controls
To assess both signal-to-blank ratio (S:B) and signal fold increase (F0:F) a cell-free kinetic experiment using a 96-well plate was set up. The control wells were set up as follows for the MitoXpress Xtra Oxygen Consumption Assay:
- Blank (B) = media
- Signal control (S, F) = media and MitoXpress Xtra reagent
- GOx control (F0) = media and reagent deoxygenated by using 0.1 mg/mL GOx
For the pH-Xtra Glycolysis Assay the following controls were prepared:
- Blank (B) = respiration buffer
- Signal control (S, F) = respiration buffer and pH-Xtra reagent
- GOx control (F0) = respiration buffer containing both pHXtra reagent and GOx at 0.1 mg/mL.
Cell-based assay
HepG2 cells were seeded at 50,000 cells per well in a 96-well, clear-bottom, tissue-culture treated microplate. Outer perimeter wells were not used for cells but were filled with PBS to avoid edge effects. To ensure an even distribution, cells were incubated at room temperature for 15 minutes prior to overnight culture in an incubator (5% CO2 at 95% humidity, 37°C).
For the MitoXpress Xtra Oxygen Consumption Assay, MitoXpress Xtra reagent was reconstituted in 1 mL of deionised water, then warmed to 37°C. Cells were carefully washed with complete growth media so as not to dislodge cells from the bottoms of the wells. 80 μL of the pre-warmed complete growth media were added to each well, and the plate was then placed on a plate heater to equilibrate it to 37°C. A repeater pipette was used to add 10 μL MitoXpress Xtra reagent to all wells except wells designated Blank, to which 10 μL of water was added instead. 10 μL of 10X compounds (FCCP, oligomycin, antimycin A), or water containing DMSO at a final concentration of 0.1%, were added to triplicate wells. 100 μL of HS oil was added on top of each well to limit oxygen entering the samples. The plate was then transferred to the SpectraMax i3x reader, and data acquisition was started using a preconfigured protocol in SoftMax Pro Software 7.0.3 or higher.
For the pH-Xtra Glycolysis Assay, cells were first incubated under CO2- free conditions, 95% humidity at 37°C, for 2.5 hours prior to measurement. Meanwhile, pH-Xtra reagent was reconstituted in 1 mL of deionised water, then warmed to 37°C. Respiration buffer was made by dissolving the respiration buffer tablet in 50 mL of deionised water, then the pH was adjusted to 7.4, and the solution was filter-sterilised. Cells in the microplate were carefully washed with respiration buffer. 80 μL of pre-warmed respiration buffer was added to each well, and the plate was placed on the plate heater to equilibrate it to 37°C. A repeater pipette was used to add 10 μL pH-Xtra reagent to each well. 10 μL of 10X compounds (2-deoxyglucose, oligomycin), or water containing 0.1 % DMSO, were added to wells in triplicate.
Data acquisition and analysis
The SpectraMax i3x reader was used to acquire assay data using the TRF Detection Cartridge. The optimized acquisition parameters in TRF mode for both MitoXpress Xtra and pH-Xtra reagents are shown in Table 1. 100 pulses per read was found to be optimal for this assay (data not shown). The reader temperature was set to 37°C for at least 15 minutes prior to the measurement. The microplate was inserted into the reader, and kinetic data traces were recorded as intensity over time using SoftMax Pro Software. The kinetic read was set to read at 2- to 4-minute intervals over a 45- to 200-minute period. For each experiment, the shortest possible interval was selected.
Ex: 370 nm
Em: 616 nm
Fluorescence
Ex: 370 nm
Em: 642 nm
Integration time: 0.1 ms
Excitation time: 0.05 ms
Number of pulses: 100
Measurement delay: 0.1 ms
Read height: 2.30 mm
Integration time: 0.1 ms
Excitation time: 0.05 ms
Number of pulses: 100
Measurement delay: 0.03 ms
Read height: 2.30 mm
Total run time: 1 to 2 hours
Interval: 2 to 4 minutes
Table 1. Optimized settings for MitoXpress Xtra and pH-Xtra assays on the SpectraMax i3x reader.
Prior to exporting the data to Excel, the data were blank corrected in the software. The slope function in Excel was used to calculate the rates for either oxygen consumption (MitoXpress Xtra) or glycolytic activities (pH-Xtra). The slope was determined in the linear portion of the graph to ensure that the appropriate section of the sample signal curve was interrogated.
Preconfigured protocols for use with compatible Molecular Devices plate readers, for SoftMax Pro 7.0.3 and higher, are available for download from www.softmaxpro.org. Recommended acquisition settings for the readers are listed in the protocols’ Instrument Settings section. To process the data directly in the software, use the kinetic reduction to calculate the rates. The linear portion of the kinetic data trace is adjustable by manually selecting the lag and end time in the Reduction dialog.
Results
MitoXpress Xtra Oxygen Consumption Assay
To assess the optimal instrument setup, both signal-to-blank ratio (S:B) and signal fold increase (F0:F) were calculated using a cell-free kinetic experiment. The SpectraMax i3x reader achieved a S:B greater than 10 as shown in Figure 1. To determine the signal fold increase, a GOx control (F0) was measured, which was deoxygenated by using GOx. This GOx control showed approximately 3-fold increase in signal compared to the oxygenated signal control (F), indicating that the assay was set up correctly and was measuring oxygen depletion.
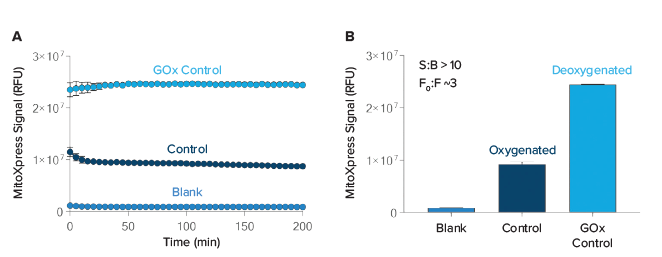
Figure 1. Determination of signal to blank and signal fold increase. (A) Signal traces were plotted for blank and control wells. The mean values of data traces were calculated from the 15th to 20th data points to avoid initial temperature equilibration and were plotted in (B). Signal-to-blank ratio (S:B), as well as signal fold increase (F0:F), were calculated (n = 2, ± SD).
A cell-based assay was used to evaluate the compatibility of the SpectraMax i3x reader with the MitoXpress Assay (Figure 2). Cells were treated with two compounds that affect oxygen consumption, oligomycin and FCCP. Untreated cells showed an increase in MitoXpress Xtra signal as oxygen was depleted in the media. Treatment with oligomycin, which decreases oxygen consumption via inhibition of ATP synthase, resulted in a lower oxygen consumption than untreated cells (Figure 2, oligomycin). FCCP increases oxygen consumption by uncoupling respiratory complexes from ATP synthase (Figure 2, FCCP), and the rate was therefore significantly higher for FCCP-treated cells than for untreated cells.
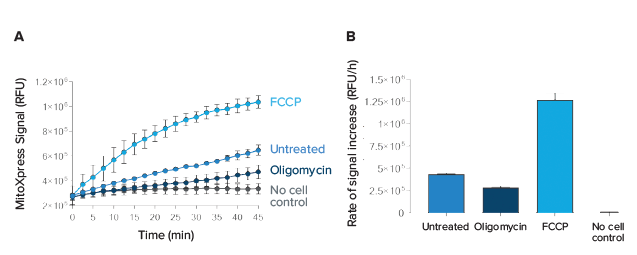
Figure 2. Cell-based oxygen consumption assay using MitoXpress Xtra. (A) Signal profiles of MitoXpress Xtra reagent for HepG2 cells. Cells were treated with oligomycin and FCCP. (B) Rates were calculated by taking the slope of the linear portion of kinetic traces (n = 3, ± SD).
pH-Xtra Glycolysis Assay
As with the MitoXpress Xtra Assay, signal-to-blank ratios were determined for the pH-Xtra Glycolysis Assay to ensure optimal reader settings. Control wells generated a S:B ratio greater than 100 (Figure 3). The signal control represented the starting pH of the respiration buffer. As with MitoXpress Xtra, the signal fold increase was determined using a GOx control. This control generates H+ ions by acidifying the buffer as it reacts with glucose (Figure 3). The signal fold ratio showed a significant signal increase (i.e. ratio >3), indicating that the assay was set up correctly and was measuring acidification.
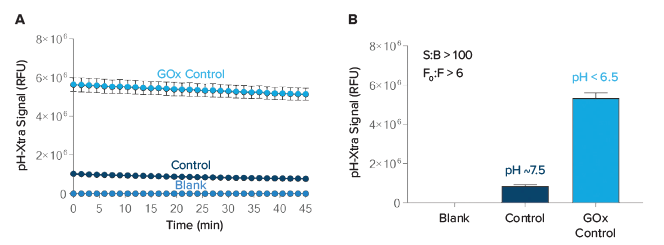
Figure 3. Signal-to-blank and maximum intensity calculations for pH-Xtra. Signal traces (A) were plotted for control wells as well as blank. The mean of all data traces was calculated from the 15th to 20th data points and plotted in (B). Signal-to-blank ratio (S:B), as well as signal fold increase (F0:F) were calculated (n = 2, ± SD).
The ability of the pH-Xtra Glycolysis Assay to assess extracellular acidification is illustrated in Figure 4. Cells were treated with two compounds, oligomycin and 2-DG, that modulate extracellular acidification. Oligomycin treatment increased pH-Xtra signal (Figure 4, oligomycin) by inhibiting mitochondria ATP production, causing cells to account for loss of ATP by increasing glycolytic ATP production. 2-DG treatment reduced the rate of signal change by competitively inhibiting glucose phosphorylation, resulting in decreased lactate production by glycolysis (Figure 4, 2-DG).
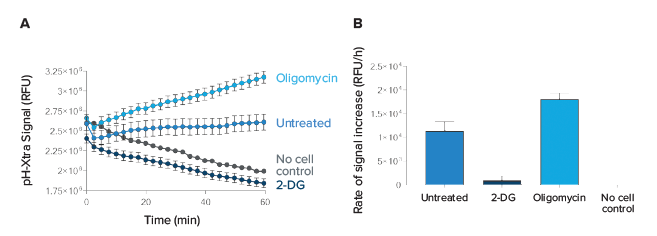
Figure 4. Cell-based pH-Xtra Glycolysis Assay. (A) TRF signal profiles for HepG2 cells using pH-Xtra Glycolysis Assay. Cells were treated with oligomycin or 2-DG. (B) Rates were calculated by taking the slope of the linear portion of kinetic traces. Rates were corrected to No Cell Control (n = 3, ± SD).
Conclusion
The SpectraMax i3x reader performed well above the signal performance criteria set for the assays by Agilent Technologies and was successfully used to measure cell-based assays for the analyses of mitochondrial function and glycolytic flux. Preconfigured SoftMax Pro Software protocols for Molecular Devices plate readers are available for MitoXpress Xtra and pH-Xtra to test the signal performance as well as acquire and analyze assay data. Rates can be generated either in Excel or directly from the signal profile in SoftMax Pro Software and can be further reduced for graphing within the software or easily exported for external graphing software.
简介
Cathleen Salomo | Applications Scientist | Molecular Devices GmbH
Ryan McGarrigle, PhD | Research Scientist | Agilent Technologies Ireland Ltd.
Conn Carey, MSc | Technology Specialist | Agilent Technologies Ireland Ltd.
为了生存,细胞需要 ATP 形式来提供能量 维持正常生理活性。这种形式的能量是通 过糖酵解和线粒体呼吸过程产生的。当两 者都产生 ATP 时,糖酵解在缺乏氧气的情 况下可以发挥作用,而线粒体在氧化磷酸 化 (OXPHOS) 的最后一步需要氧气参与产 生 ATP。这些途径在适应环境压力、底物 可用性和缺氧的同时,动态地转变以满足 细胞的能量需求。一般而言,测量其动态 的变化提供了比单点测量 ( 例如 ATP 终点 法 ) 更多的关于代谢反应的信息。呼吸作 用受到抑制是药物毒性后线粒体功能紊乱 的重要、敏感指标。线粒体功能的异常与 越来越多的疾病有关,从神经退行性病变 到癌症。
了解这些途径是如何应对效应化合物作出何种反应,可以为了解细胞的整体功能和决定细胞命运的潜在机制提供有用的见解。
新型检测试剂盒的出现和更多功能微孔板 读板机的问世,为实现基于微孔板形式的 代谢分析提供了有效的手段。这里,我们 描述了在 SpectraMax® i3x 微孔读板机上 使用 Agilent MitoXpress® Xtra 耗氧量分 析和 Agilent pH-Xtra™ 糖酵解分析。
采用基于细胞检测的葡萄糖氧化酶 (GOx) 法,使用标准 96 孔板评价细胞氧耗和糖 酵解。
采用基于细胞检测的葡萄糖氧化酶 (GOx) 法,使用标准 96 孔板评价细胞氧耗和糖 酵解。MitoXpress Xtra 耗氧量分析可以直接实 时测量细胞耗氧量。该试剂是一种氧敏感 的水溶性、穿膜形荧光探针。通过 O2 淬 灭荧光信号,使得信号与孔中 O2 的浓度 成反比。随着氧气的消耗,荧光逐渐增 加,因此利用动力学测量,用户可以通过 监测信号增加的速度来推断线粒体的活 性。
The pH-Xtra 糖酵解检测试剂可实时的、 动态的检测细胞外的酸化率。糖酵解途径 的葡萄糖它可以产生丙酮酸盐,用于在 Krebs 循环中进一步氧化或产生乳酸盐 ( 乳 酸 ),这使得细胞酸化胞外环境。pH 值的 变化可使用 pH-Xtra 进行检测,为解糖酵解 活性的研究提供了依据。如同 MitoXpress Xtra 一样,pH-Xtra 在生物范围内表现出 灵敏的信号反应,可灵活、高通量地评估 细胞外酸化率,并且在反应过程中不被消 耗。根据荧光信号随时间的变化计算细胞 外酸化率。
材料
- HepG2 细胞 (ATCC cat. #HB-8065)
- 来自黑曲霉-IV 型的葡糖氧化酶 (Sigma-Aldrich cat. #G2133)
- 完全生长培养基
- Dulbecco 的改良 Eagle 培养基-高葡糖 (DMEM, Sigma-Aldrich cat. #D5796)
- 胎牛血清 (Sigma-Aldrich cat. #F244
- 青霉素/链霉素 (Sigma-Aldrich cat. #P4333)
- 测试化合物
- 抗霉素 A (Sigma-Aldrich cat. #A8674)
- 乙腈4- ( 三氟甲氧基 ) 苯基氢化区 (FCCP, Sigma-Aldrich cat.#C2920)
- 2-脱氧-D-葡萄糖 (2-DG, Sigma-Aldrich cat. #D8375)
- 寡霉素 A (Sigma-Aldrich cat. #75351)
- MitoXpress Xtra 耗氧量分析试剂 (Agilent Technologies cat. #MX-200-4), 包含:
- MitoXpress Xtra 试剂
- 封闭油
- pH-Xtra 糖酵解分析试剂 (Agilent Technologies cat. #PH-200-4), 包含:
- pH-Xtra 试剂
- 呼吸缓冲片
- 微孔板
- 96-孔, 底透, 组织培养微孔板 (Sarstedt cat. #83.3924.300)
- SpectraMax i3x 多功能微孔读板机 (Molecular Devices, cat. #i3x) 带 TRF 检测卡盒 (Molecular Devices cat. #0200-7008)
方法
对照信号
为了评估信号与空白比 (S:B) 和信号倍数 增加 (F0:F),建立了 96 孔板无细胞动力学 实验。针对 MitoXpress Xtra 耗氧量分析 建立了如下对照孔:
- Blank (B) = 培养基
- Signal control (S, F) = 培养基和 MitoXpress Xtra 试剂
- GOx control (F0) = 培养基和 利用 0.1 mg/mL GOx 脱氧的试剂
针对 pH-Xtra 糖酵解分析准备了如下对照:
- Blank (B) = 呼吸缓冲液
- Signal control (S, F) = 呼吸缓冲液和 pH-Xtra 试剂
- GOx control (F0) = 包含pHXtra试剂和 0.1 mg/mL GOx的呼吸缓冲液
基于细胞的检测
HepG2 细胞以每孔 50,000 个接种于 96- 孔、底透的组织培养微孔板中。细胞培养 孔外周围的孔不用于细胞培养,但需加入 PBS 以避免边缘效应。为了确保细胞的均 匀分布,细胞先在室温下孵育 15 分钟, 然后在孵箱中过夜培养 ( 95% 湿度下 5% CO2 , 37°C )。
对于 MitoXpress Xtra 耗氧量分析实验, MitoXpress Xtra试剂溶于 1 mL 去离子水 中,然后在 37°C 下进行如孵育。利用细 胞用完全生长培养基小心清洗细胞,以免 将细胞从孔底冲走。在每孔中加入 80 µL 预热的完全生长培养基,然后将孔板放置 在孔板加热器上,使其平衡到 37℃。使用 自动移液器将 10 µL MitoXpress Xtra 试剂 加入除空白孔的所有孔中,而空白孔则代 之以加入 10 µL 水。
10 µL 的 10X 化合物 ( FCCP、寡霉素、抗 霉素 A ) 或 0.1% 终浓度的 DMSO 水溶液以 3 个复孔进行加液。每孔顶部加入 100 µL 封闭油以限制氧气进入样品。接下来将孔 板移入 SpectraMax i3x 读板机中,利用 SoftMax Pro 软件 7.0.3 或更高版本中的预 置模板进行数据采集。
对于 pH-Xtra 糖酵解分析实验,细胞检测 前首先在 37°C、95% 湿度和无 CO2 条件 下孵育 2.5 小时。与此同时,pH-Xtra 试 剂重溶于 1 mL 去离子水中,再孵育至 37°C。用 50 mL 去离子水溶解呼吸缓冲片 制成呼吸缓冲液,然后调节 pH 至 7.4,将 溶液过滤灭菌。微孔板中的细胞用呼吸缓 冲液小心清洗。每孔加入 80 µL 预热的呼 吸缓冲液,然后将孔板放置在孔板加热器 上,使其平衡到 37℃。使用自动移液器将 10 µL pH-Xtra 试剂加入每孔中。10 µL 的 10X 化合物 ( 2-脱氧葡萄糖、寡霉素 ) 或 0.1% 终浓度的 DMSO 水溶液以 3 个复孔 进行加液。
数据采集和分析
利用 SpectraMax i3x 读板机上 TRF 检测 卡盒获取实验数据。在 TRF 模式下,针对 MitoXpress Xtra 和 pH-Xtra 试剂的优化检 测参数如表 1 所示。每次读数为 100 次信 号收集被认为是针对这一实验的最佳选择 ( 数据未展示 )。检测前至少 15 分钟将读 板机温度设置到 37°C。将微孔板放入读板 机,利用 SoftMax Pro 软件将动力学数据 跟踪记录为一段时间内的强度。动力学读 数设置为 2 到 4 分钟间隔,总时间 45 到 200 分钟。对于每个实验,选择最短的间 隔。
Ex: 370 nm
Em: 616 nm
Fluorescence
Ex: 370 nm
Em: 642 nm
Integration time: 0.1 ms
Excitation time: 0.05 ms
Number of pulses: 100
Measurement delay: 0.1 ms
Read height: 2.30 mm
Integration time: 0.1 ms
Excitation time: 0.05 ms
Number of pulses: 100
Measurement delay: 0.03 ms
Read height: 2.30 mm
Total run time: 1 to 2 hours
Interval: 2 to 4 minutes
表 1 SpectraMax i3x 读板机上针对MitoXpress Xtra和pH-Xtra检测的优化后设置
在将数据导出到 Excel 之前,在软件中对 数据进行了修正。利用 Excel 中的斜率函 数计算氧耗率 (MitoXpress Xtra) 或糖酵解 活性 (pH-Xtra)。
在图的线性部分确定斜率,以确保查询样本信号曲线的适当部分。
兼容 Molecular Devices 微孔板读板机的 SoftMax Pro 7.0.3 或更高版本软件预置检 测模板,其可从 www.softmaxpro.org 官 网下载。推荐的读板机检测参数设置列在 模板的仪器设置部分。若要在软件中直接 处理数据,请使用动力学运算模式来计算 速率。动力学数据的线性部分可以通过在 运算对话框中手动选择延迟和结束时间来 进行调整。
结果
MitoXpress Xtra 耗氧量分析实验
为评估最佳仪器设置,使用无细胞动力学 实验计算信噪比 (S:B) 和信号倍数增加 (F0:F)。
SpectraMax i3x 读板机获得了超过 10 倍 的 S:B 值,如图 1 所示。为了确定信号的 倍数增加,我们检测了一个用 GOx 进行脱 氧的 GOx 对照 (F0)。与加氧信号对照 (F) 相比,GOx 对照的信号大约增加了 3 倍, 表明该检测方法的建立是正确的,并且正 在检测氧耗量。
图 1 空白与信号倍数增长的确定。 (A) 为空白孔和对照孔绘制信号跟踪图。数据轨迹的平 均值是从第 15 点到第 20 点计算的,以避免初始温度平衡,并绘制在 (B) 计算信号空白比 (S:B) 以及信号倍数增长 (F0:F) (n = 2, ± SD)
细胞实验用于评估 SpectraMax
SpectraMax i3x 读板机与 MitoXpress 实 验的兼容性 ( 图 2 )。用两种影响细胞耗氧 量的化合物寡霉素和 FCCP 来处理细胞。 未经处理的细胞显示,随着培养基中氧的 耗尽,MitoXpress Xtra 信号增加。寡霉 素通过抑制 ATP 合成酶降低耗氧量,导致 耗氧量低于未处理的细胞 ( 图 2,寡霉 素 )。FCCP 通过解偶联 ATP 合成酶的呼 吸复合物 ( 图 2,FCCP ) 来增加氧气消 耗,因此 FCCP 处理的细胞的耗氧率显著 高于未处理的细胞。
图 2 使用 MitoXpress Xtra 进行细胞耗氧量分析实验。 针对 HepG2 细胞的 MitoXpress Xtra 试剂的信号分布。用寡霉素和 FCCP 处理细胞。(B) 速度是通过取运动轨迹的 线性部分的斜率来计算的 (n = 3, ± SD)
pH-Xtra 糖酵解分析实验
与 MitoXpress Xtra 实验一样,测定 pH-Xtra 糖酵解实验的信噪比,以确保最 佳读数设置。对照孔的信噪比高于 100 ( 图 3 )。信号对照代表呼吸缓冲液的起始 pH 值。与 MitoXpress Xtra 一样,使用 GOx 对照来确定信号倍数增加。这一对照通过 酸化缓冲液与葡萄糖反应产生 H+ 离子 ( 图 3 )。信号倍数比呈显著增加 ( 例如,比值 >3 ),表明该检测方法正确建立,并在测 定酸化过程中起着重要作用。
图 3 信号-空白和最大强度计算用于 pH-Xtra 信号跟踪。 (A) 为对照孔和空白孔绘制曲 线。从第 15 至 20 个数据点计算所有数据轨迹的平均值,并绘制在 (B) 计算信号空白比 (S:B) 以及信号倍数增长 (F0:F) (n = 2, ± SD)
pH-Xtra 糖酵解实验评估细胞外酸化的能 力如图 4 所示。用两种化合物,寡霉素和 2-DG 处理细胞,调节细胞外酸化。寡霉 素处理通过抑制线粒体 ATP 的产生而增加 pH-Xtra 信号( 图 4,寡霉素 ),通过增加 糖酵解 ATP 的产生而导致细胞对 ATP 的 损失。2-DG 治疗通过竞争性抑制葡萄糖磷 酸化降低了信号变化的速率,从而通过糖 酵解降低了乳酸盐的产生 ( 图 4, 2-DG )。
图 4 基于细胞的 pH-Xtra 糖酵解分析实验。 (A) 。(A) pH-Xtra 糖酵解法检测 HepG2 细胞 TRF 信号谱。细胞用寡霉素或 2-DG 处理。(B) 通过获取动力学轨迹的线性部分的斜率来计算 速率。将速率校正为无细胞对照。(n = 3, ± SD)
结论
SpectraMax i3x 微孔板读板机其性能高于 Agilent 技术所规定的信号性能标准,并成 功地用于基于细胞分析线粒体功能和糖酵 解流的测试。预设的用于 Molecular Devices 读板机的 SoftMax Pro 软件模板可用于 MitoXpress Xtra 和 pH-Xtra 测试信号表现 以及获取和分析数据。
可以在 Excel 中或直接从 SoftMax Pro 软 件中的信号中获得其速率值,并且可以进 一步利用数据在软件中进行绘图,或直接 导出至其它软件进行曲线拟合和图表制 作。