
Application Note
Multitask kinetic measurements of IPTG’s effects on protein expression and cell growth
- Measure several different signals simultaneously over time
- Utilize a diverse set of algorithms and curve fits for comprehensive data analysis
- Set up a simple protocol using the Workflow Editor
Introduction
Measuring several different signal outputs simultaneously over time is especially useful for studying a protein or compound’s effect on cellular growth or gene expression. In this application note, we measure cell growth (absorbance) and protein expression (fluorescence) using SoftMax® Pro 7 Software.
In bacteria, the lac operon is a cluster of genes under the control of one promoter, which encodes ß-galactosidase. After ligating a protein’s sequence into a plasmid containing the lac operon and transfecting bacteria with the plasmid, one can use this transformed bacteria to express the protein of interest. Normally, the lac promoter is allosterically repressed, but in the presence of isopropyl ß-D-1-thiogalactopyranoside (IPTG), the repressor is released from the promoter sequence causing expression of the protein of interest. Conversely, if there is excessive IPTG, the cells will divert disproportionate cellular resources into protein expression and their growth rate will be stunted1 .
We demonstrate how E. coli responds to a dilution series of IPTG by measuring cell density and protein expression simultaneously.
Materials
- SpectraMax® M2 Multi-Mode Microplate Reader (Molecular Devices)
- Luria Broth (LB) Media (Teknova cat. #L8080)
- Ampicillin Sodium Salt (Teknova cat. #A9525)
- 1 M IPTG (Teknova cat. #I3431)
- 96-well clear, flat-bottom polystyrene microplate (Greiner cat. #655-161)
- E. coli containing pBbE5-RFP plasmid (Keasling Lab)
Methods
E. coli containing the pBbE5-RFP plasmid (Figure 1) was supplied by Professor Jay D. Keasling2. The E. coli strain was grown to 0.3 OD600 in LB media containing 100 µM ampicillin. Afterwards, 100 µL of E. coli was transferred to a clear 96-well microplate. A two-fold serial dilution of IPTG starting from 500 µM was used to treat the E. coli. 0 µM IPTG and a media-only control were assayed as well.
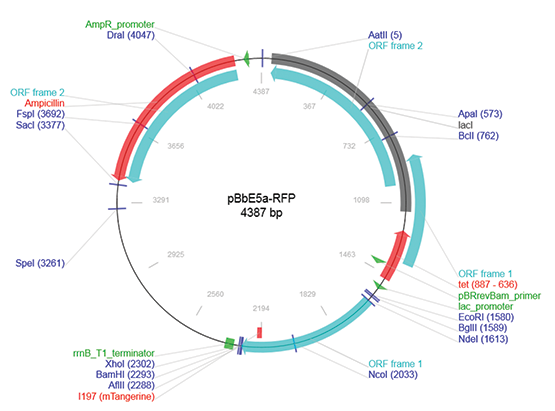
Figure 1. pBbE5a-RFP plasmid map.
The microplate was then placed in a SpectraMax M2 Multi-Mode Microplate Reader and incubated at 32°C for the duration of the kinetic assay. Using the SoftMax Pro 7 Workflow Editor, a kinetic cycle containing an absorbance read and a fluorescence read, with a 10-second plate shake between reads, was created with the settings shown in Table 1. The kinetic cycle was set to repeat once every 10 minutes for a total of 24 hours. The resulting dual read mode kinetic data was analyzed using SoftMax Pro 7 Software.
Table 1. Instrument settings for measuring cell density and protein expression.
Results
The kinetic traces for absorbance and fluorescence measurements are shown in Figures 2 and 3 respectively. In Figure 2, increasing IPTG concentration caused a decrease in OD600 values indicating an adverse effect on bacterial growth. In Figure 3, increasing IPTG concentration did not result in an increase of red fluorescent protein (RFP) expression. In contrast, increasing IPTG concentration caused a decrease in overall RFP expression. This decrease in RFP expression was most likely due to plateauing bacterial growth.
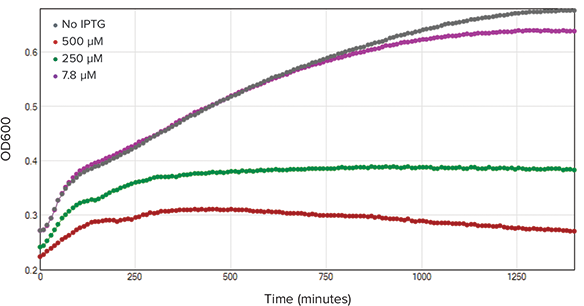
Figure 2. OD600 kinetic trace. OD600 readings were recorded every 10 minutes over the course of 24 hours (n=3). As IPTG concentration increased, bacterial growth rate decreased.
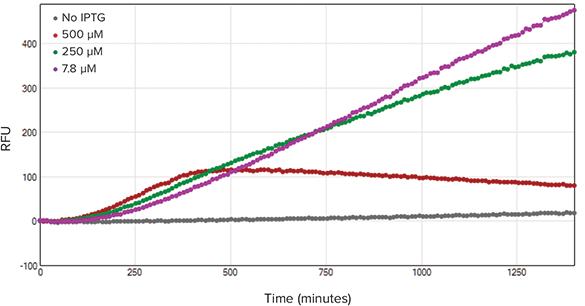
Figure 3. Fluorescence kinetic trace. Fluorescence was recorded alongside OD600 measurements (n=3). With the exception of the 500 µM IPTG-treated wells, fluorescence output was relatively similar for all concentration ranges.
In Figure 4, a reduction was applied to both the absorbance and fluorescence data sets to calculate the area under the curve (AUC). This analysis was performed using SoftMax Pro 7 Software and summarizes IPTG’s effects on cell growth and protein expression. IPTG’s effect on fluorescence was similar throughout all concentrations with the exception of 500 µM, where increasing IPTG concentration caused a decrease in bacterial growth (absorbance).
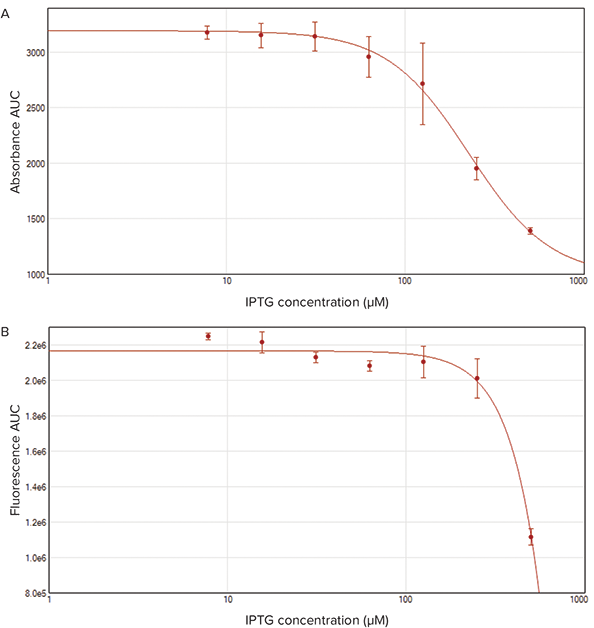
Figure 4. Area under the curve (AUC) of absorbance and fluorescence measurements. The AUC for absorbance (A) and fluorescence (B) were calculated and plotted using SoftMax Pro 7 Software. A 4-parameter curve was applied to demonstrate the effect of IPTG on cell growth (absorbance) and protein expression (fluorescence).
Calculating the RFP/OD600 values allowed for measuring protein expression relative to population density. Using SoftMax Pro 7 Software, we calculated the RFP/OD600 ratio (Figure 5). Based on the kinetic trace, the 250 µM IPTG- treated bacteria expressed the most RFP per cell.
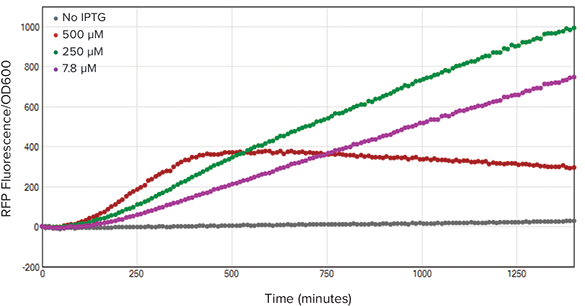
Figure 5. RFP/OD600 ratios. The ratio of fluorescence to cell density was calculated by dividing fluorescence values by OD600 values. After normalizing the fluorescence to cell density, the 250 µM IPTG-treated bacteria (green) demonstrated the highest RFP concentration per cell.
Conclusion
We demonstrated how Molecular Devices SoftMax Pro 7 Software and multi-mode microplate readers can measure several biological events simultaneously over a course of time. The experimental concepts shown in this application note, although simple, can be applied to more complex experiments.
References
- Malakar, P. and Venkatesh, K.V. (2012) Effect of substrate and IPTG concentrations on the burden to growth of Escherichia coli on glycerol due to the expression of Lac proteins. Applied Microbiology and Biotechnology, 93(6), 2543-2549.
- Lee, T.S., Krupa, R.A., Zhang, F., Hajimorad, M., Holtz, W.J., Prasad, N., Lee, S.K., and Keasling, J.D. (2011) BglBrick vectors and datasheets: a synthetic biology platform for gene expression. Journal of Biological Engineering, 5, 12.
Learn more >>
简介
在一段时间内同时检测几种不同信号的输 出尤其在研究蛋白或化合物对细胞生长或 基因表达作用方面很有帮助。在本应用指 南里,我们利用SoftMax® Pro 7版本软件 同时来检测细胞生长(光吸收)和蛋白表达 (荧光)。
在细菌中,lac操纵子是一种由编码ß-半乳糖苷酶的启动子调控的基因群。将一个蛋白表达序列插入到含有lac操纵子的质粒中并转染细菌,可使这一转化细菌来表达感兴趣的蛋白。通常情况下,lac启动子是被变构抑制的,但是在异丙基-ß-D-1-硫代半乳糖苷(IPTG)存在下,阻遏物从启动子序列释放引起感兴趣蛋白的的表达。相反,如果IPTG过量,细胞会转变为优先将胞内物质用于蛋白表达并且细胞生长也会受到阻碍。
通过同时检测细胞密度和蛋白表达,我们展示了大肠杆菌(E.coli)是如何响应系列稀释的IPTG的。
材料
- SpectraMax® M2多功能酶标仪 (Molecular Devices)
- Luria Broth (LB)培养基(Teknova cat.#L8080)
- 氨苄青霉素(Teknova cat.#A9525)
- 1 M IPTG (Teknova cat. #I3431)
- 96-孔透明平底聚苯乙烯多孔板 (Greiner cat. #655-161)
- 含有pBbE5-RFP的E. coli质粒 (Keasling Lab)
方法
包含pBbE5-RFP质粒(图1)的大肠杆菌 (E. coli)由Jay D.Keasling2教授提供。大 肠杆菌(E. coli)菌株培养在含有100 µM氨 苄青霉素的LB培养基中,生长到OD600 为0.3时,再将100 µL的大肠杆菌(E. coli) 转移到透明96孔板中。用起始浓度500 µM 的IPTG两倍系列稀释来处理大肠杆菌(E. coli)。0 µM IPTG和只含培养基的对照也 分别进行检测。

表 1. 测定细胞密度和蛋白表达的仪器参数设置
微孔板放入SpectraMax M2多功能酶标仪 中32°C孵育并用动力学法检测。利用 SoftMax Pro7软件的工作流程编辑器,创 建包括光吸收和荧光两种检测方法的动力 学循环,读数之间震板10秒,参数设置如 表1。循环每10分钟1次,共24小时。使用 SoftMax Pro7版本软件对产生的两种检测 方法的动力学数据进行分析。
表 1. 测定细胞密度和蛋白表达的仪器参数设置
结果
光吸收和荧光检测的动力学曲线分别由图2和图3所示。图2中,不断增加IPTG浓度导致OD600下降,意味着对细菌生长起反作用。图3中,提高IPTG浓度不会引起红色荧光蛋白(RFP)表达量的增加。相反,提高IPTG浓度会导致总RFP表达量的减少。这一减少可能是因为细菌生长停滞造成的。

图 2. OD600动力学追踪。OD600读数24小时内每10分钟记录一次(n=3)。IPTG浓度增加,细菌 生长减慢。

图 3. 荧光动力学追踪。测定OD600同时记录荧光强度(n=3)。除了500 µM IPTG处理的孔以外, 荧光强度在其他所有浓度范围内都是相似的。
在图4中,对光吸收和荧光数据做处理以计 算曲线下的面积(AUC)。采用SoftMax Pro7版本软件进行分析并总结出IPTG对 细胞生长和蛋白表达的影响。IPTG对荧光 的影响在除500 µM浓度外的其他所有浓度 中效果都是相似的,即提高IPTG浓度导致 细菌生长下降(光吸收)。

图 4. 光吸收和荧光检测的曲线下面积(AUC)。光吸收(A)和荧光(B)的AUC通过SoftMax Pro7版本 软件计算并描绘曲线。4参数曲线应用于说明IPTG对细胞生长(光吸收)和蛋白表达(荧光)的作用。
计算RFP/OD600的比值可以用来测定蛋白 表达相对于细菌群体密度。使用SoftMax Pro7版本软件,我们计算出RFP/OD600 比值(图 5)。基于动力学追踪,250 µM IPTG处理的细菌每个细胞所表达的RFP 是最多的。

图 5. RFP/OD600 比值。荧光与细胞密度的比值通过荧光强度值除以OD600值得到。将荧光比细 胞密度标准化后,250 µM IPTG处理细菌(绿色)表明了每个细胞中有更高的RFP浓度。
结论
我们展示了Molecular Devices SoftMax Pro7版本软件和多功能酶标仪配合使用能 够在一段时间内同时检测许多生物学事 件。尽管展示的实验较为简单,但这一应 用也适合于更为复杂的实验。
参考文献
- Malakar, P. and Venkatesh, K.V. (2012) Effect of substrate and IPTG concentrations on the burden to growth of Escherichia coli on glycerol due to the expression of Lac proteins. Applied Microbiology and Biotechnology, 93(6), 2543-2549.
- Lee, T.S., Krupa, R.A., Zhang, F., Hajimorad, M., Holtz, W.J., Prasad, N., Lee, S.K., and Keasling, J.D. (2011) BglBrick vectors and datasheets: a synthetic biology platform for gene expression. Journal of Biological Engineering, 5, 12.
Learn more >>