
Application Note
Automation and high content imaging of 3D triple-negative breast cancer patient-derived tumoroids assay for compound screening
- Automate complex protocols with 3D cell models
- Investigate compound responses in patient-derived tumoroids
- Analyze tumoroids and phenotypic changes using High Content Imaging
Oksana Sirenko, Angeline Lim | Molecular Devices
Evan F Cromwell, Ekaterina Nikolov | Protein Fluidics, Inc.
Margarite D Matossian, Courtney K Brock, Bridgette M. Collins-Burow, and Matthew E Burow | Tulane University
Introduction
Triple negative breast cancer is a clinically aggressive tumor subtype, with high rates of metastasis, recurrence, and drug resistance. Currently there are no clinically approved small molecule targeted therapies for this disease, underlining the critical need to discover new therapeutic targets. Patient-derived cell-based 3D cancer models are highly valuable tools for cancer research, drug development and personalized medicine. Primary tumorderived models can recapitulate tumor heterogeneity and morphology, as well as complex genetic and molecular composition thereby accelerating drug development and drug testing. However, the complexity of performing 3D assays remains a hurdle for adoption the methods for compound screening.
In the present study we describe automation of imaging and cell culture methods that enables scaling up complex 3D cell-based assays. We developed an integrated workcell that includes an IXM-C HT.ai confocal imaging system, an automated CO2 incubator, an automated liquid handler (Biomek i7), and a Collaborative Robot. Workcell protocol settings allow automation of compound testing, culture monitoring, and evaluation of phenotypic effects of drugs with high content imaging. Tumoroids were formed from primary cells isolated from a patient-derived tumor explant, TU-BcX-4IC, that represents metaplastic breast cancer with a triple-negative breast cancer subtype. During incubation with compounds tumoroids were monitored daily using transmitted light imaging, with machine learning-based image analysis that allowed characterization of tumoroids size, diameter, integrity and optical density. For end point assay tumoroids were stained with viability dyes and imaged using automated confocal imaging system. We characterized multiple quantitative descriptors that could be used for studying tumor phenotypes and compound effects including characterization of size and integrity, cell morphology and viability, as well as determining presence and expression levels for various cell markers.
We describe methods and demonstrate tools for increase of throughput and automation in 3D cancer assays and compound screening. In addition, we show advanced analysis approaches and descriptors that allow scientists to gain more information about complex cellular systems, disease phenotypes and compound effects.
Methods
Cell cultures
The methods for generating tumoroids and PDX organoids (PDXO) have been previously described (Matossian, et al 2021). The primary tumor sample was implanted into SCID/Beige mice and exhibited rapid tumor growth, with 14 days to reach maximal tumor volume >1000 mm3 , Then cell line was generated from that sample able to be expanded in 2D culture. Tumoroids were formed from 4IC cells expanded in 2D. 4IC cells were dispensed \~2,000 cells per well (in U-shape low attachment 384 plates, Corning) and incubated for 48 hours until they formed tight tumoroids. 4IC cells were cultured with Advanced DMEM supplemented with glucose, NEAA, 2mM glutamine and insulin 120μg/L, 10% FBS (Gibco 12491-015). For metabolic assays, tumoroids were cultured with DMEM + 10% dialyzed serum (2mM glutamine, 5mM glucose, without phenol red.
Cell monitoring and imaging
Transmitted light (TL) of fluorescent images were acquired on the ImageXpress Confocal HT.ai High-Content Imaging System (Molecular Devices) using MetaXpress HighContent Image Analysis Software. Tumoroid images were acquired in TL with approximately 60 μm offset. Z-stack images were acquired with the 10X or 20X objectives using confocal mode. MetaXpress or IN Carta™ Image Analysis Software were used for analysis.
Automation of cell culture and imaging protocols
Automated imaging and analysis of organoids are important for quantitative assessment of phenotypic changes in organoids, and for increasing throughput for experiments and tests. We built an automated, integrated system that allows automated monitoring, maintenance, and characterization of growth and differentiation of organoids and stem cells, as well as testing the effects of various compounds. The automated system includes ImageXpress Confocal HT.ai system and analysis software, automated CO2 incubator, Biomek i7 liquid handler, collaborative robot and rail. Robotic automation was enabled by Green Button Go solution.
Results
Culturing and imaging 3D tumoroids
3D tumoroid culture was started from primary triple negative tumor (see Methods section). Cell line was developed by passaging primary tissues in SCID mice, then adopted for 2D cell culture. Tumoroids were formed by culturing 2,000 cells in 384 well low attachment plates for 48h, then tumoroids were treated with compounds from NCI (National Cancer Institute) library of approved anti-cancer drugs. Five concentrations were used for testing
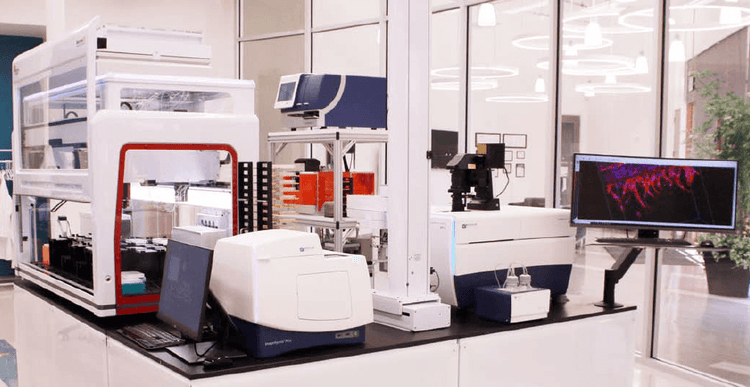
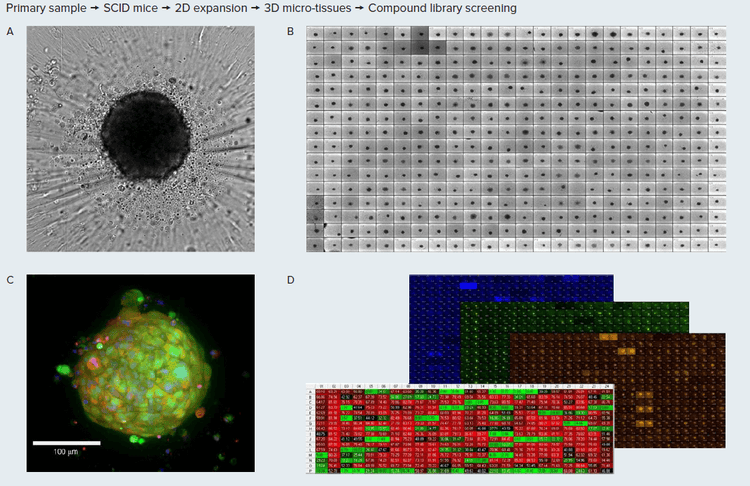
Figure 1. A. Tumoroids formed 48h after plating, TL images (10X). B. Tumoroids in culture after treatment with compounds. C. Tumoroid stained with E-cadherin (green), CD44 (red) and Hoechst, confocal image, 20x. D, Tumoroids were treated with compounds for 5 days then stained with Hoechst dye (blue), calcein AM (green) and EtHD (red), 10X. Organoids wre imaged using confocal option, Z-stack of 15 images 10 µm apart, maximum projection images shown. Image analysis using Custom Module Editor (MetaXpress software) for finding organoids, nuclei, live and dead cells.
Automation of cell culture, compound treatment, and imaging
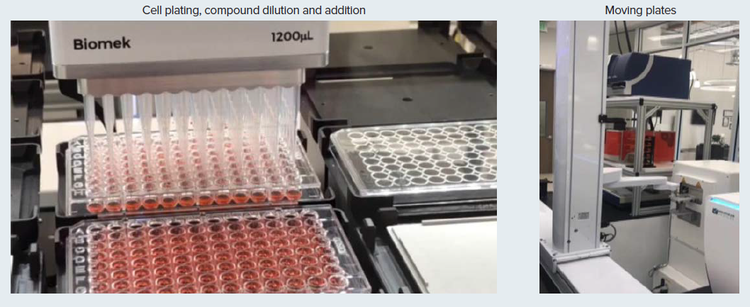
Biomek automation was used for compound dilutions, cell treatments, and staining. Then tumoroids were cultured and monitored daily by automated imaging. Tumoroid phenotypes, density, and sizes were automatically detected and characterized by AI-based image analysis. For end point assay cells were stained with combination of Hoechst, calcein AM and EtHD and analyzed using Custom Module Editor for complex phenotypic analysis.
Identification of compounds from NCI library targeting metaplastic triple-negative breast cancer tumoroids
3D tumoroid cultures provide a very useful tool for disease modeling and assessment of compound effects. Automated workflow allows to scale up of assay for compound screening and increase assay reproducibility and ease of use. Automated imaging and analysis of tumoroids are important for quantitative assessment of phenotypic changes in tumoroids, and for monitoring complexity of biological responses. Multiple readouts from the imaging included tumoroid size, integrity (area), intensities for different markers, cell count and characterization.
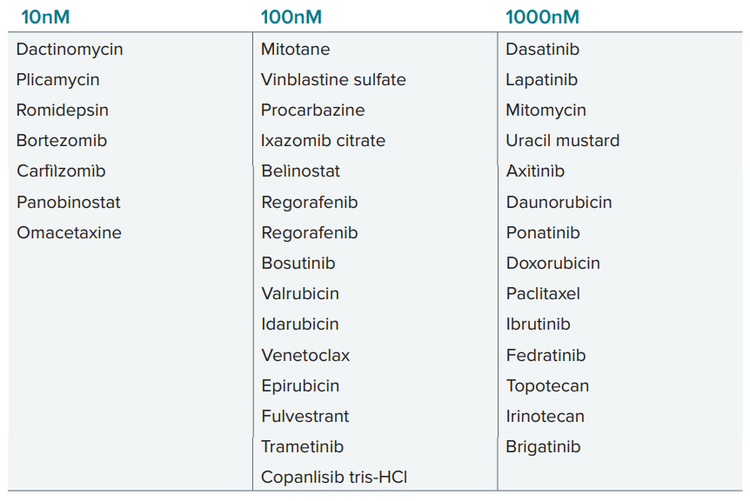
We have tested effects of 168 compounds from NCI library at 5 concentrations with 10x dilutions: 10nM, 100nM, 1000nM (1μM), 10μM and 100μM. Then we used assessment of tumoroid integrity (tumoroid area) and viability (% live cells) to identify hits across different concentrations. Several drugs were identified that demonstrated efficacy of targeting tumor subtype resistant to traditional cancer therapy. Drugs listed below demonstrated efficacy effecting tumoroid phenotypes at indicated concentrations (higher concentration included also ones listed for lower concentrations).
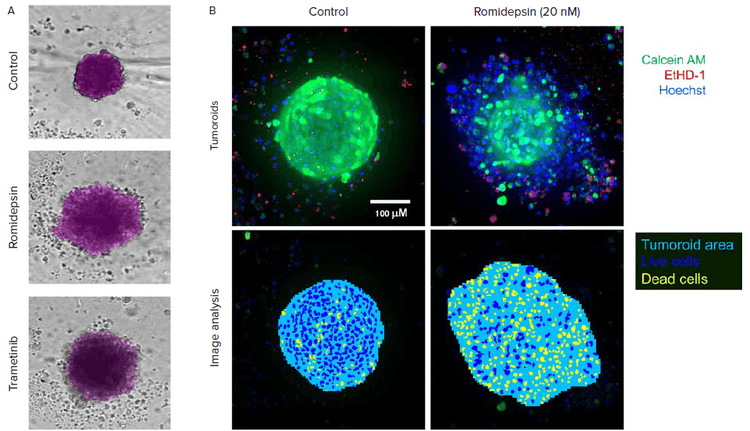
Figure 2. A. Automated image analysis of 3D cancer microtissues was done using transmitted light images (10X) with AI-based image analysis In Carta software (analysis mask shown in purple). B. End-point analysis of fluorescent images was done using Custom Module Editor ImageXpress software. Images and analysis masks shown. Multiple measurements were derived for cell scoring and organoid characterization
List of compounds effective at indicated concentrations:
Dose-response and secondary characterization of selected compounds
A sub-set of compounds was selected for secondary follow-up analysis. Compounds were tested across 7 concentrations in the 1–10000 nM range. EC50 values were determined using tumoroid dis-integration measurement.
Conclusions
- We demonstrate compound screening assay using 3D tumoroids derived from primary triple negative metaplastic cancer cell sample. We tested 168 compounds from NCI library across several concentrations and identified several compounds that show efficacy in 3D cell assay.
- The process for tumoroid assay and compound treatment was automated by integrating automated imaging system, liquid handler, and automated incubator, and a collaborative robot. The instruments allowed automated cell culture, maintenance, and compound treatment of 3D cellular models that can be used for compound screening in cancer biology.
- Confocal imaging in combination with 3D analysis allows complex, quantitative analysis of cellular content of organoids as well as count and measurements of cells with different phenotypes. The methods can be used for testing effects of anti-cancer compounds and disease modeling.