
Application Note
High-content quantitation of cancer stem cells from a glioblastoma cell line cultured in 3D using GrowDex-T hydrogel
- Investigate a scalable high-content assay based on U-251 MG cell line to study cancer stem cells
- Acquire high-quality images with GrowDex-T transparent hydrogel, optimized for imaging HTS and HCS applications
- Obtain accurate 3D volumetric measurements using ImageXpress Micro Confocal system
Yiming Meng | Research Scientist | University of Reading, UK
Jonathan Sheard, PhD | Applications Scientist | UPM Biomedicals
Andy Bashford, PhD | Applications Scientist | Molecular Devices
Introduction
Culturing cell models in 3D has the advantage of recreating a more in vivo-like cell environment. With this improved physiological relevance comes a variety of considerations to balance the biological and experimental complexity including ease of use, repeatability, handling time, reagent costs, assay flexibility, and the ability to automate assays in higher throughput. A critical component in any model is the choice of material to enable cells to grow and mature in 3D.
The GrowDex® hydrogels are composed of nanofibrillar cellulose characterized as a well-defined and highly reproducible hydrogel that is temperature stable and ready to use without the need for gel preparation. The material mimics the extracellular matrix (ECM) providing a support to enable cells to interact in 3D while allowing the diffusion of small molecules such as nutrients1,2. GrowDex hydrogels are shear-thinning materials meaning they are viscous hydrogels at rest but become fluid under shear stress when pipetting or injecting. Many 3D scaffold materials cause scattering or absorption of visible light, making them less suitable for imaging applications. GrowDex®-T is a transparent version of the hydrogel which offers improved imaging quality, making it an attractive option for high-content screening assays3.
Here, we describe a 3D assay to investigate the stemness of the human glioblastoma cell line, U-251 MG. The cancer stem cell (CSC) theory proposes a model where a small subpopulation of self-renewing cells is responsible for sustaining and propagating tumors4. U-251 MG cells represent an easily accessible cell line that display cancer stem cell like qualities5,6 and are suitable for expansion and subsequent screening studies. We demonstrate how these cells can be grown into 3D spheroids, fixed and labeled for CSC-marker nestin7. Subsequent highcontent imaging with the ImageXpress® Micro Confocal High-Content Imaging System and 3D volumetric analysis of the CSC-population demonstrate a useful and relevant high-throughput assay for studying cancer stem cell biology in a 3D model.
Materials
- U-251 MG cell (formerly known as U-373 MG) (ECACC cat. #09063001)
- Growth media: DMEM High glucose, 2 mM L-glutamine, 10% FCS, 1% B27, 20ng/ml EGF, 20ng/ml FGF
- GrowDex-T hydrogel (UPM Biomedicals, cat. #200 103 005)
- Greiner 96 Well Microplates, μClear® (Greiner, cat. #655096)
- 4% Paraformaldehyde (PFA)
- Phosphate buffered saline (PBS)
- Phosphate buffer saline with 0.1% Triton X-100 (PBS-Triton)
- Phosphate buffer saline with 0.02% sodium azide (PBS-azide)
- Blocking buffer: Phosphate buffered saline, 0.02% Tween, 5% goat serum
- 4′,6-Diamidino-2-phenylindole dihydrochloride (DAPI) diluted in PBS (1:2000) (Sigma-Aldrich)
- Phalloidin-Atto 550 diluted in PBS (0.2 nM, 1:100) (Sigma-Aldrich)
- Nestin mouse monoclonal antibody (diluted 1:250 blocking buffer) (R&D Systems, #196908)
- Goat anti-mouse Alexa Fluor 488 (diluted 1:300 blocking buffer) (Invitrogen)
- ImageXpress Micro Confocal equipped with 4X Plan Apo Lambda air objective and 40X WI CFI Plan Apochromat water immersion objective, laser light source with deep tissue penetrating confocal disk module. Custom Module Editor with 3D volumetric tools.
Methods
- 2D Culture preparation: U251 cells were culture expanded in 2D and incubated at 37°C with 10% CO 2 . Following trypsinization, cells were resuspended in complete media at a concentration of 1x10⁷ cells/mL.
- Cell-hydrogel preparation: A working cell solution with 1x10⁶ cells/mL in 0.2% GrowDex-T hydrogel was created and 50 μL placed into each well of a 96-well plate (Figure 1A). The working cell solution was created as a 1 mL volume by adding 200 μL of GrowDex-T hydrogel to 700 μL of complete media and mixing thoroughly by pipetting, while avoiding bubbles. 100 μL of cells in suspension at a concentration of 1x10 7 cells/mL was then added and mixed thoroughly. After addition to a 96-well plate, cells in hydrogel were left for 30 minutes incubation at 37°C and 50 μL of standard culture medium added on top (Figure 1A).
- 3D Culture growth: Cells were cultivated for 72 hours at 37°C and 10% CO 2 . Medium was changed once in the middle of the culture period. This media change and other fixation/washing/staining steps mentioned below were completed as follows: 50 μL of supernatant was carefully removed from the edge meniscus of the well, ensuring not to disturb the hydrogel. 50 μL of fresh media/PBS/PFA was added to the well by placing the pipette to the edge of the well and adding the liquid slowly.
- Spheroid fixation: Media was carefully removed from cultures ensuring not to disturb the hydrogel layer, 4% PFA was carefully added to wells for 20–30 minutes and gently washed twice for five minutes with PBS.
- Spheroid staining: Fixed spheroids were incubated in blocking buffer for 30 minutes followed by incubation with nestin primary antibody. Spheroids were gently washed in PBS and incubated with secondary Alexa Fluor antibody. All washes and incubations were completed with gentle agitation at 4°C overnight. Spheroids were then washed with PBS-Triton for 30 minutes, washed with PBS for five minutes and allowed to incubate at 4°C overnight with DAPI and phalloidin stains. After staining, samples were washed overnight in PBS and transferred to PBS-azide ready for imaging.
- Imaging and analysis: 96-well plates were imaged using the ImageXpress Micro Confocal system. QuickID targeted acquisition was used on single field of view acquired at 4X magnification using DAPI channel. Spheroids were automatically selected based on size, shape, and subsequently imaged at high magnification. Images were acquired in the DAPI, FITC, TRITC channels through a Z-stack of 25 steps with 5 μm step size.
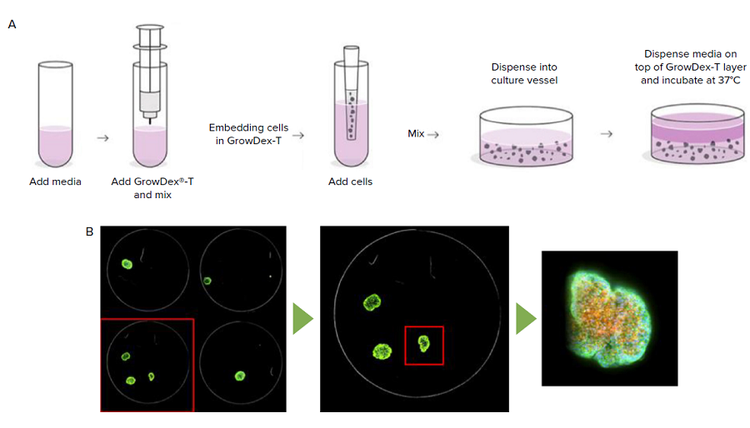
***Figure 1.*Methods Summary. GrowDex-T anionic nanofibrillar cellulose (aNFC) is prepared by dilution in cell culture media followed by addition of cells and dispensing into 96-well plate (A). Example of QuickID targeted acquisition showing structure identification at low magnification followed by acquisition at high magnification (B).
Results
Acquisition of CSC marker in 3D spheroids grown in GrowDex-T hydrogel
U-251 MG Cells were grown in 3D with addition of compounds to target different cell signaling pathways. Here, we outline the assay concept used to study the spheroids in a high throughput and high content way using the ImageXpress Micro Confocal system; full results and the compound effect will be published elsewhere.
After 72 hours in culture, 3D Spheroids were distributed throughout the GrowDex-T hydrogel with a loose and irregular shape showing significant outgrowth into the surrounding matrix (Figure 2A). Nestin positive cells were clearly identified throughout the spheroid with some nestin positive cells extending small processes within the 3D structure (Figure 2B). Filamentous actin labeled with phalloidin can be seen throughout the spheroids with distinct clusters of punctate staining throughout the spheroid (Figure 2C).
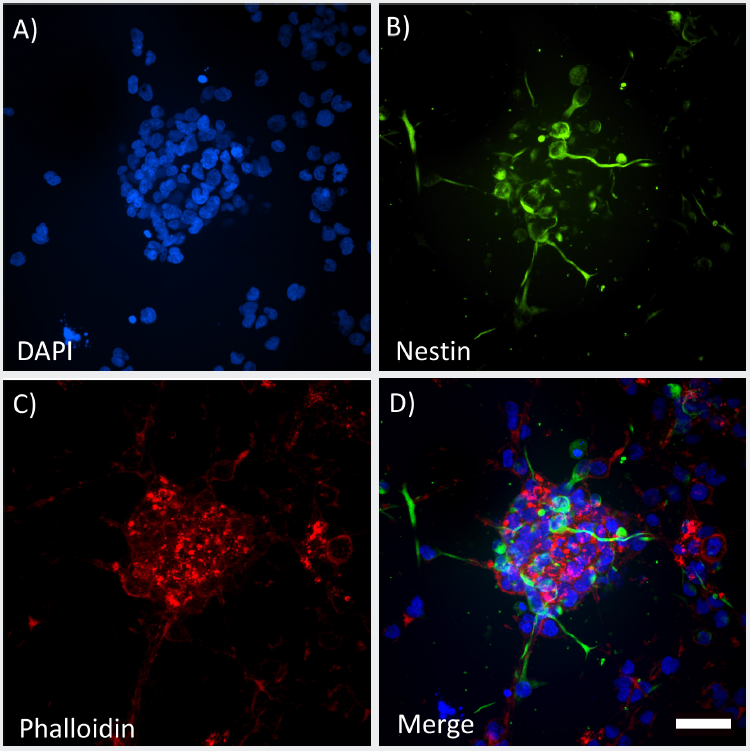
***Figure 2.*High clarity images of 3D spheroids grown in GrowDex-T. Maximum projection images acquired on the ImageXpress Micro Confocal using the 40X Water Immersion CFI Apochromat LWD Lambda S. Z-stack of 120 μm (20 x 5 μm step size). Fixed spheroids were labeled for DAPI (A), Nestin (B) and Phalloidin (C) and all channels merged (D). Scale bar = 50 μm
Spheroids were located 100–200 μm above the bottom of the well and imaged using 40X water immersion lens. Structures were imaged in their entirety with a Z-stack covering 120 μm in depth which was possible due to the long working distance (LWD) lens. Despite imaging through up to 250 μm of GrowDex-T hydrogel, high clarity images were obtained clearly visualizing spheroid structure.
This setup shows a method that U-251 cells can be grown in a 3D hydrogel and display CSC markers in only a subpopulation of the spheroid structure. This represents a way that behavior or physiology of CSCs can be studied in a high throughput or automated way.
Improve efficiency using QuickID targeted acquisition
A common challenge acquiring images in complex 3D cell cultures is identifying appropriate structures and their position within the well. This assay used QuickID targeted acquisition to perform an initial 4X low magnification scan (Figure 3A) followed by a high magnification 40X acquisition (Figure 3B). This functionality enabled the system to automatically position spheroids in the center of each field of view. Detection of spheroids in the low magnification image used the functionality of the Custom Module Editor, allowing structures of interest to be filtered in an unbiased way based on a range of measurements such as their, size, shape, position or intensity (Figure 3A).
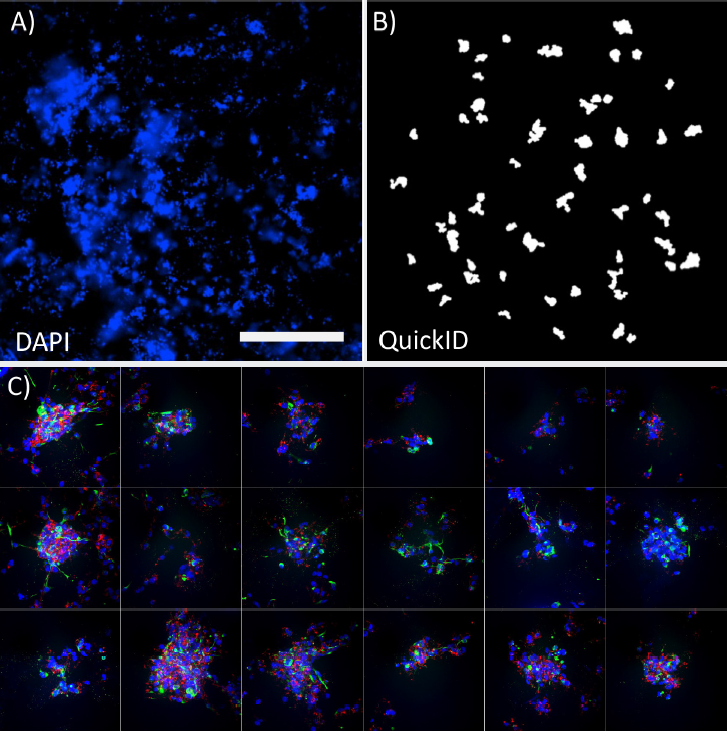
***Figure 3.*QuickID workflow. Low magnification 4X image of DAPI labeled spheroids (A) and the corresponding QuickID object detection for high magnification scanning (B). Panel of high magnification (40X) images illustrating spheroids accurately centred in each field of view. Scale bar = 1 mm.
The use of a targeted acquisition protocol enabled the high-content acquisition to be highly efficient; minimizing acquisition time and storage space in a way that is fully compatible with the water immersion objectives. In this example, QuickID was used on the DAPI channel alone but this initial scan could easily be extended to multiple channels or transmitted light for object detection. This approach maximized image quality at 40X magnification, accurately positioning structures in the middle of the field of view improving the visualization and analysis of the structures.
Utilize volumetric analysis tools in the Custom Module Editor
Quantitation of the spheroids at high magnification was completed using the 3D analysis tools available in the Custom Module Editor (Figure 4 A,B). Masks detecting the whole spheroid outline were generated using the phalloidin staining. The total cell population was detected using the DAPI nuclear stain and the Nestin-positive cytoplasm was detected allowing cells to be scored as positive or negative. All of these masks were constructed in 3D and their accuracy verified by creating 3D renderings of the masks, view, and rotating these using the 3D viewer (Figure 4 C,D).
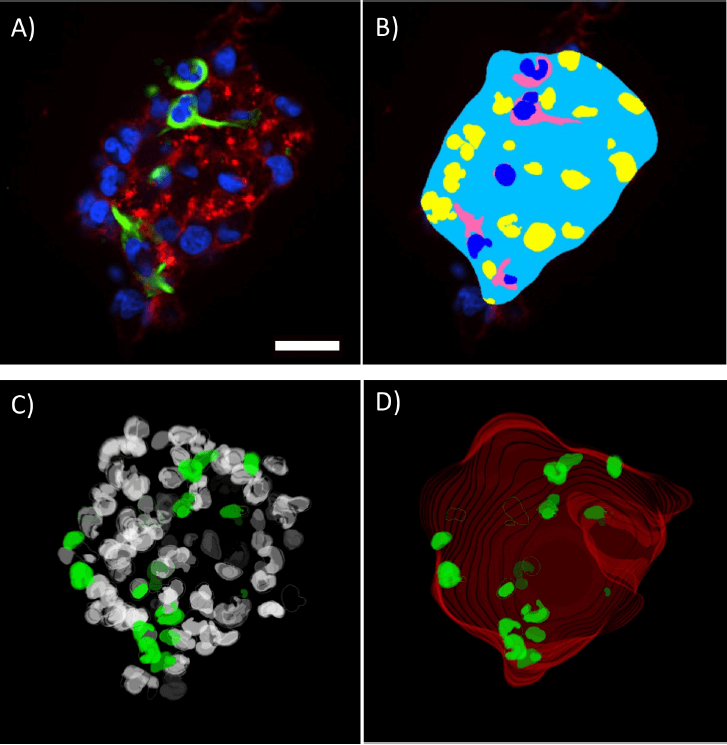
***Figure 4.*3D volumetric analysis of spheroids. Single Z-plane of spheroid labeled for DAPI, nestin and phallodin (A) with the corresponding analysis mask created in the Custom Module Editor (B). 3D rendering of the volumetric nuclear analysis mask (C) showing total cell population (white) and nestin positive nuclei (green). Spheroid outline mask (D) showing volumetric rendering of whole spheroid outline (red) and nestin positive nuclei (green). Measurements quantified from the displayed spheroid (E). Scale bar = 30 μm
Morphology measurements of the spheroid included volume, depth, and diameter (Figure 4E). Quantitation of the nestin-positive cells and their volume in the spheroid was also possible and could be compared to the surrounding population of nestin-negative cells. This provides an example of quantitation of the CSC population and is something that could be automatically quantified on a spheroid-by-spheroid basis.
Conclusion
We demonstrated a 3D assay to assess the CSC population of U-251 MG spheroids. The cells were grown in GrowDex-T hydrogel, which provided 3D support for the structures to grow while allowing diffusion of small molecules and capture of high-quality images.
Developing 3D high-content assays that are suitable for high-throughput screening requires careful consideration to balance the physiological complexity with experimental factors such as the reproducibility, ease-of-use, and suitability for automation. GrowDex-T hydrogel provided a well-defined support for the cells that was easy to work with and provided a reliable means of assay development. Importantly, the optically clear hydrogel, in combination with the ImageXpress Micro Confocal system, allowed acquisition of high-clarity images to measure the entire CSC population in each spheroid.
The use of the MetaXpress® High-Content Image Acquisition & Analysis Software demonstrated high efficiency image capture using QuickID targeted acquisition and 3D volumetric analysis to quantify the spheroid morphology and CSC population. This assay represents a scalable high-content assay suitable for the study of factors or compounds regulating CSC biology in a glioblastoma cell line.
References
- Malinen, Melina M et al. “Differentiation of liver progenitor cell line to functional organotypic cultures in 3D nanofibrillar cellulose and hyaluronan-gelatin hydrogels.” Biomaterials vol. 35,19 (2014): 5110-21. doi:10.1016/j.biomaterials.2014.03.020
- Lou, Yan-Ru et al. “The use of nanofibrillar cellulose hydrogel as a flexible three-dimensional model to culture human pluripotent stem cells.” Stem cells and development vol. 23,4 (2014): 380-92. doi:10.1089/scd.2013.0314
- Sheard, Jonathan J et al. “Optically Transparent Anionic Nanofibrillar Cellulose Is Cytocompatible with Human Adipose Tissue-Derived Stem Cells and Allows Simple Imaging in 3D.” Stem cells international vol. 2019 3106929. 7 Oct. 2019, doi:10.1155/2019/3106929
- Prager, Briana C et al. “Cancer Stem Cells: The Architects of the Tumor Ecosystem.” Cell stem cell vol. 24,1 (2019): 41-53. doi:10.1016/j.stem.2018.12.009
- Cao, Xiangmei et al. “A new approach to screening cancer stem cells from the U251 human glioma cell line based on cell growth state.” Oncology reports vol. 29,3 (2013): 1013-8. doi:10.3892/or.2012.2206
- Zhang, Suojun et al. “Identification of U251 glioma stem cells and their heterogeneous stem-like phenotypes.” Oncology letters vol. 6,6 (2013): 1649-1655. doi:10.3892/ol.2013.1623
- Neradil, Jakub, and Renata Veselska. “Nestin as a marker of cancer stem cells.” Cancer science vol. 106,7 (2015): 803-11. doi:10.1111/cas.12691