
Application Note
A high-content tube formation assay using an 𝘪𝘯 𝘷𝘪𝘵𝘳𝘰 angiogenesis model
- Automate 3D angiogenesis assay
- Minimize labor and time for quantifying tube formation
- Generate multiple phenotypic measurements
- Screen anti-angiogenic substances in a high-density format
Eurofins Panlabs Discovery Services Taiwan, Ltd.
Scaling up automated tube formation assay for targeting tumor angiogenesis
Angiogenesis, the formation of new blood vessels from existing ones, is a critical step involved in various biological processes, such as endothelial sprouting, proliferation, migration, invasion, and differentiation1, 2. Dysregulated angiogenesis is a hallmark of disease status and is related to a broad range of clinical implications3-5. Among these, therapeutics targeting tumor angiogenesis has been a promising alternative approach to suppress tumor growth.
For a specific aim to develop therapeutics against tumors, a robust in vitro angiogenesis model that recreates a physiopathological environment is imperative to assess endothelial cells’ response to inhibitory or stimulatory compounds2. Tube formation assay is one of the models that is representative of an in vivo microenvironment1, 6, 7, and it allows researchers to rapidly evaluate anti-angiogenic effects by quantifying capillary-like tubular structures derived from endothelial cells grown in an extracellular matrix (Figure 1).
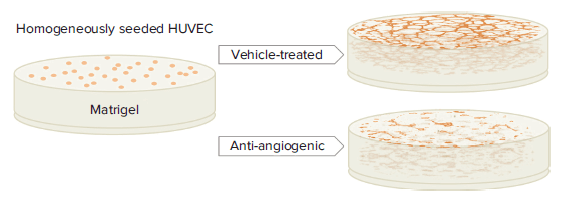
Figure 1. Principle of tube formation assay. HUVEC are mixed with basement matrix and plated into 96-well microplates. Under vehicle-treated culture conditions, capillary-like tubular structures will spontaneously take shape, while tubules will fail to form and, instead, accumulate in clumps in the presence of angiogenesis-inhibiting compounds.
This application note describes our development of an automated tube formation assay that streamlines image acquisition and analysis, which is a major bottleneck for scaling up similar assays. By combining fluorescent stains and a high-content imaging system, intact 3D tubule structures can be visualized better, and multiple phenotypic measurements can be generated to characterize antiangiogenic effect on tube morphology.
The anti-cancer drug Suramin was used to demonstrate the robustness of our method that ensures assay throughput, sensitivity, and consistency.
Materials
- Human umbilical vein endothelial cells (HUVEC) (ATCC, Cat #CRL-1730)
- 96-well cell culture plate
- Matrigel (Corning)
- Crystal Violet (MilliporeSigma)
- Calcein AM (Thermo Fisher Scientific)
- Suramin (MilliporeSigma)
- ImageXpress Micro Confocal High-Content Imaging System and MetaXpress High-Content Image Acquisition and Analysis Software (Molecular Devices)
Methods
HUVEC were plated over pre-solidified Matrigel in a 96-well microplate at 15,000 cells per well. Immediately after seeding, HUVEC were treated with 0.4% vehicle or a series of Suramin dilutions, ranging from 1.25 μM to 80 μM. After 18 hours of incubation at 37°C, 5% CO2, cells were stained with Calcein AM or Crystal Violet. The plate was imaged on the ImageXpress® Micro Confocal system using a 2X Plan Apo objective and the FITC and Cy5 filter sets for Calcein AM and Crystal Violet, respectively. Since tubes formed a three-dimensional network in Matrigel, a series of images spanning a 1.3 mm range along the z axis were acquired. A Best-Focus algorithm projected tube structures from each z stack into two-dimensional images in real time and the resulting images were analyzed by a custom module in MetaXpress® software. The custom module extracted and identified individual tubular or nodular structures and then exported total tube length, total tube area, tube number, and node number as readouts (Figure 2).
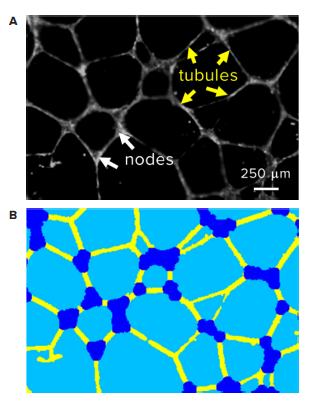
Figure 2. Automatic quantification of tubular network. (A) Representative image of tubular network revealed by fluorescent stain followed by examples of image analysis steps. (B) Corresponding segmentation of individual tubules (yellow) and nodes (blue) identified by MetaXpress software.
To determine the anti-angiogenic potency of Suramin, results from Suramin-treated wells were compared to vehicle-treated and no-cell wells. The effectiveness of Suramin on interfering with angiogenesis was determined by normalizing total tube length to those of vehicle control, and the dosage series was fitted using 4-parameter nonlinear regression. The minimal inhibitory concentration (MIC ≥ 30%) was scored as a significant response, and half maximal inhibitory concentration (IC50) was calculated accordingly.
Improve tube visualization and quantification using fluorescent viable stain
Staining cells with Crystal Violet and visually inspecting them under a light microscope is the most typical way of measuring tube formation. Due to endothelial cells’ nature to grow into a three-dimensional network in basement membrane-like substrate, and the intrinsic limitations of brightfield microscopy, it is challenging to accurately capture all tubular structures under uneven illumination (Figure 3A). Besides, manual measurement of tube formation is labor intensive and is subjected to human bias. These pitfalls compromise assay performance and limit the possibility of scaling up similar assays.
We overcame these limitations by employing fluorescent stains along with a low magnification objective to acquire whole-well images of tubular structures. Compared with brightfield images of Crystal Violet stain, the fluorescence of Calcein AM or the autofluorescence of Crystal Violet improves image contrast and the resulting image is nearly vignette-free (Figure 3B). The longer depth of field of the low magnification objective and automated z stacking also help capture more tubules grown in three dimensions. Furthermore, the Calcein AM vital dye staining eliminates the need for sample fixation and reduces washing steps, which is a potential source of tube breakage or other artifacts.
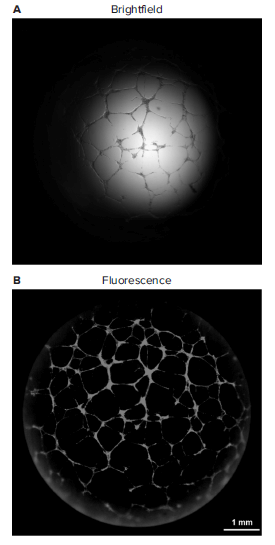
Figure 3. Brightfield versus fluorescent whole-well image of tubular network using 2x PA objective. The quality of fluorescent image after 3D stacking (A) is superior to brightfield (B) in terms of field of view and illumination evenness.
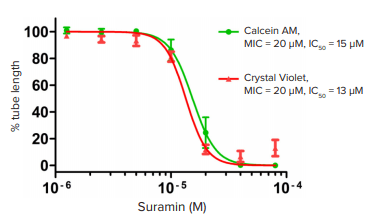
To showcase the performance of this modified protocol, Suramin, a compound known to inhibit angiogenesis by targeting fibroblast growth factor and vascular endothelial growth factor (VEGF) receptor signaling, was used as a positive control. Through automatic segmentation of fluorescent images projected from 3D stacks, tubular and nodular structures can be revealed and quantified (Figure 4). Statistical analysis shows that Suramin significantly inhibited tube formation, as indicated by total tube length, in a concentration dependent manner with a Z’ factor of 0.75 (Figure 5). These results are comparable to those conducted using brightfield imaging and manual quantification, but the assay time is greatly reduced from eight hours to less than 30 minutes for a 96-well plate.
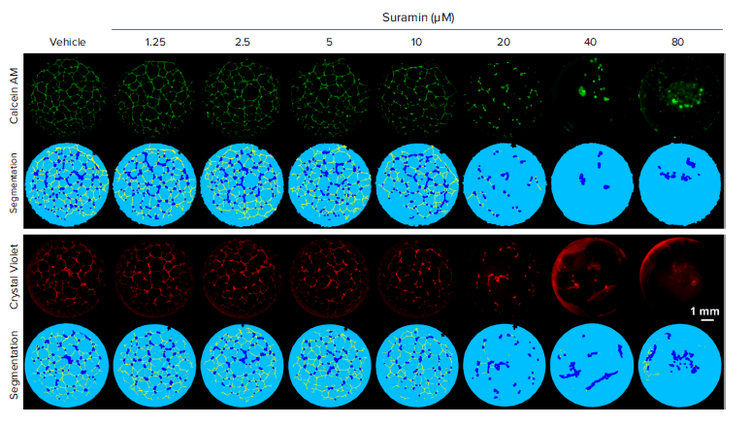
Figure 4. Dose-dependent anti-angiogenic effect of Suramin. HUVEC grow into a tubular network in vehicle-treated wells while Suramin treated wells exhibit dose-dependent reduction in tube formation. Note that while Crystal Violet (lower panel) is suitable for both brightfield and autofluorescence imaging, Calcein AM stain (upper panel) shows slightly better image contrast and fewer artifacts near the well edge.
Conclusion
Numerous tube formation applications are possible with high-throughput screening
The tube formation assay can be tailored as an in vitro 3D angiogenesis tool for experiments such as selection between various sources of endothelial cells, co-culture of different cell types, alternative supplements for growth medium, varied types of support matrices, or applying angiogenic induction to stem cells6, 8-10.
However, scaling up a tube formation assay poses significant challenges through image acquisition to processing and analysis. Here, we summarized an optimized high-throughput quantification of tube formation on HUVEC for screening anti-angiogenic compounds. By utilizing fluorescent staining, z stack acquisition, the generation of a 2D projection of a whole well image, and a custom module designed with a unique image processing approach to define tubules and nodes, we were able to provide a reliable automatic analysis of a tubular network. By automating the imaging and analysis, we avoided bias to the analyzed results and thoroughly solve the time-consuming issue of manual or semi-automatic quantification. Using the ImageXpress Micro Confocal system facilitated the procedure and enabled the tube formation assay to be reliable, reproducible, and high throughput.
References
- Adv Drug Deliv Rev. 97: 250-9. 2016
- Iran J Basic Med Sci. 15: 1110-26. 2012
- Angiogenesis. 18: 433-48. 2015
- Nat Med. 9: 653-60. 2003
- Annu Rev Cell Dev Biol. 27: 563-84. 2011
- Stem Cell Res Ther. 8: 184. 2017
- Drug Discov Today. 21: 1495-1503. 2016
- J Endod. 43: 588-595. 2017
- Assay Drug Dev Technol. 15: 267-279. 2017
- Reprod Toxicol. 70: 116-125. 2017