
Application Note
Measuring mitochondrial shape and distribution using the ImageXpress Micro High-Content Imaging System
Introduction
The evaluation of mitochondrial responses is often used to determine the specific effect of chemical compounds on cell health. These responses may involve the ability of the mitochondria to sustain a steady membrane potential as exhibited by the intensity of fluorescent indicators such as some of the MitoTracker™ dyes. Other types of measurable responses are changes in the morphology and distribution of the organelle within the cell.
High-content imaging assays allow cells cultured and treated in microplates to be imaged alive without wash steps for realtime studies of cells in their most natural state, although certain dyes remain after fixation if an endpoint assay is desired. Combining high magnification, confocal optics, and collection of z-planes enables generation of 3D images for subsequent analysis as a 3D volume, vastly increasing the amount of information that can be obtained from every cell.
These assays can be performed in an automated screening environment with the ImageXpress® Micro Confocal High-Content Imaging System and MetaXpress® High-Content Image Acquistion and Analysis Software.
Materials
- MitoTracker Orange CMTMRos (Life Technologies P/N M7510)
- WI-38 human lung fibroblast cells (P12)
- Rotenone
- Chloroquine
- 384-well black, clear-bottom microplates (BD Falcon P/N 353962)
- Hoechst 33342 nuclear stain
- ImageXpress Micro Confocal High-Content Imaging System
Assay method
WI-38 cells were plated at 7,500 cells per well in 50 μL per well in a 384-well tissue culture treated microplate. They were allowed to attach for 30 minutes in a 37°C, 5% CO2incubator. Wells were then treated for 30 minutes with rotenone or chloroquine at 3 different concentrations. Finally, 10 μL of a 6X concentration of MitoTracker Orange + Hoechst was added to each well for a final concentration of 100 nM mitochondrial dye and 5 μM Hoechst. After 90 minutes incubation, plates were imaged on the ImageXpress Micro Confocal system using the DAPI and TRITC filter sets with a 40X or a 60X Plan Apo objective (Figure 1).
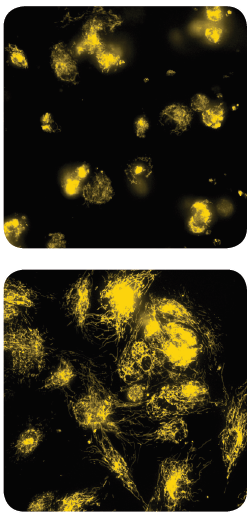
***Figure 1. Raw 2D projection images taken with 60X objective.*Mitochondria in cells treated with 50 μM Rotenone (top) and Chloroquine (bottom).
Data analysis
Cells imaged on the ImageXpress Micro Confocal system were visualized and analyzed in MetaXpress Software using the 3D analysis module. With step-wise user-input, the module accurately segments nuclei, outputs measurements on the total population of mitochondria in addition to classifying them as condensed or elongated, and supplies measurements on the separate mitochondrial morphologies. The 3D rendering from the z-series allows verification that the segmentation mask is accurately identifying objects in the raw images as well as highlighting morphometric and spatial parameters that may be of interest for analysis.
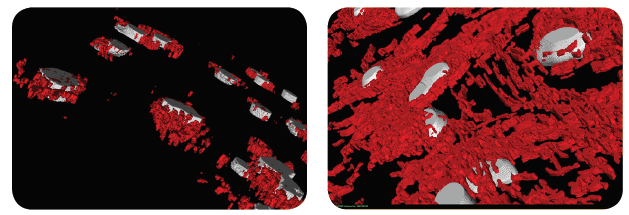
***Figure 2. 3D rendering of isosurface overlays of stained mitochondria (red) and nuclei (white). (Left)*50 μM Rotenone-treated cells exhibit condensation and close proximity to the nuclei. (Right) Chloroquine-treated cells demonstrate elongated mitochondria spread throughout the cells.
Results
This assay indicated that Chloroquine-treated cells had increased mitochondria volume while maintaining the ratio of elongated to condensed morphology found in control cells. Rotenone-treated cells exhibited condensation of mitochondria shown by a decrease in total volume as well as an increase in the ratio of condensed mitochondria compared to a control.
The ImageXpress Micro Confocal High-Content Imaging System used for acquiring high-quality images at multiple z-heights paired with the MetaXpress High-Content Image Acquisition and Analysis Software with 3D analysis module offers scientists a fast and robust image-based quantitation of multiple subcellular mitochondrial responses.
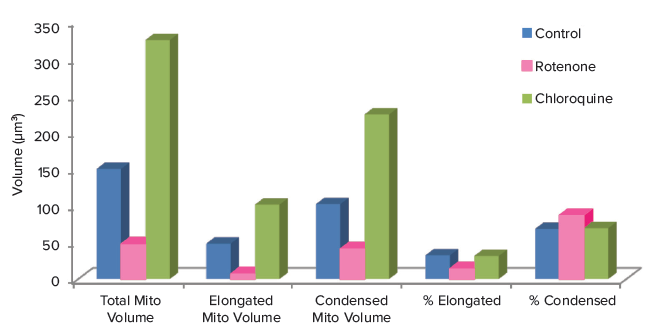
Figure 3. Measured parameters comparing cells treated with 50 μM compound to untreated controls.
Compatible with this Molecular Devices system
ImageXpress Micro Confocal High-Content Imaging System
介绍
对线粒体反应的评估通常被用于确定化合 物对细胞健康的特定影响。这些反应可能 涉及线粒体维持稳定膜电位的能力,如荧 光指示剂 ( 如某些 MitoTrackerTM 染料 ) 强 度所显示的那样。其他类型的可测量反应 是细胞内细胞器形态和分布的变化。
高内涵成像测量可以在微孔板中培养和处 理细胞,在没有洗涤步骤的情况下进行活 细胞成像,在细胞最自然状态的状态下进 行实时研究,尽管如果需要终点法测定, 某些染料在固定后仍然存在。结合高放大 倍率,共聚焦光学和z平面的集合,可以 生成三维图像,以便随后作为三维个体进 行分析,大大增加了从每个细胞中获得的 信息量。
使用 ImageXpress® Micro Confocal 高内 涵成像系统和 MetaXpress® 高内涵图像采 集和分析软件,可以在自动化筛选环境中 进行这些检测。
材料
- MitoTracker Orange CMTMRos (Life Technologies P/N M7510)
- WI - 38 人肺成纤维细胞 (P 12)
- 鱼藤酮
- 氯喹
- 384 孔黑色底透微孔板 (BD Falcon P/N 353962)
- Hoechst 33342 核染料
- ImageXpress Micro Confocal 高内涵成 像系统
测定方法
将 WI - 38 细胞以每孔 7,500 个细胞,50 μ L/孔,接种于组织培养物处理的 384 孔微 孔板中。在 37℃,5 % CO2 培养箱中附着 30 分钟。然后用 3 种不同浓度的鱼藤酮或 氯喹处理孔 30 分钟。最后向每个孔中加入 10 μL 浓度为 6 X 的 MitoTracker Orange + Hoechst,最终浓度为 100 nM 线粒体染料 和 5 μ M Hoechst。孵育 90 分钟后,将微 孔板用 ImageXpress Micro Confocal 系 统进行成像,使用 DAPI 和 TRITC 滤光片组 以及 40 X 或 60 X Plan Apo 物镜 ( 图 1 )。
***图 1 使用 60 X 物镜拍摄的原始 2 D 投影图像。*用 50 μM 鱼藤酮 ( 上图 ) 和氯喹 ( 下图 ) 处理的 细胞中的线粒体
数据分析
在 MetaXpress 软件中,使用 3D 分析模 块,可视化并分析在 ImageXpress Micro Confocal 系统上成像的细胞。通过逐步输 入用户参数,该模块可精确分割细胞核, 除了将线粒体分为收缩或伸长状态以外, 还可以输出线粒体总数的测量值,并提供 单独线粒体形态的测量值。从 z 系列得到 的 3D 渲染可以验证分割图像准确识别了 原始图像中的个体,并突出显示对分析可 能感兴趣的形态和空间参数。
图 2 染色的线粒体( 红 色 ) 和细胞核 ( 白 色 ) 的等值面覆盖图的 3D 渲染。。( 左 ) 50 μM 鱼藤酮处理 的细胞表现出收缩并靠近细胞核;( 右 ) 氯喹处理的细胞展现出在整个细胞中扩散的伸长的线粒体
结果
实验表明,经氯喹处理的细胞线粒体体积 增加,同时保持了对照组细胞中线粒体的 伸长与收缩形态的比例。与对照组相比, 鱼藤酮处理的细胞表现出线粒体的收缩, 表现为总体积的减少以及收缩状态线粒体 占比的增加。
ImageXpress Micro Confocal 高内涵成像 系统用于获取多个 z 高度的高质量图像, 配合带有 3D 分析模块的 MetaXpress 高内 涵图像采集和分析软件,为科学家提供了 一种快速、可靠的基于图像的多亚细胞线 粒体反应定量方法。
图 3 将 50 μM 化合物处理的细胞与未处理的对照组细胞进行比较的测量参数
Compatible with this Molecular Devices system
ImageXpress Micro Confocal High-Content Imaging System