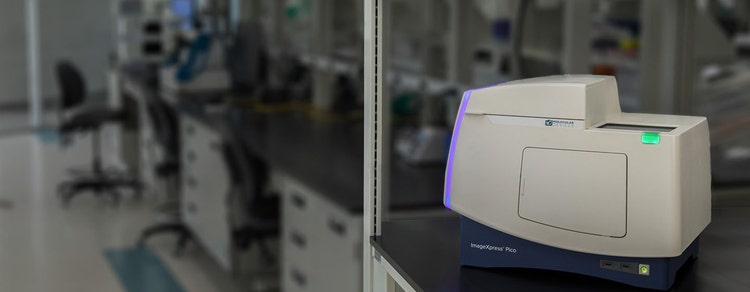
Sistema de adquisición automática de imágenes celulares ImageXpress Pico
El sistema de adquisición y análisis de imágenes celulares que le permite ir desde la muestra a los resultados en minutos
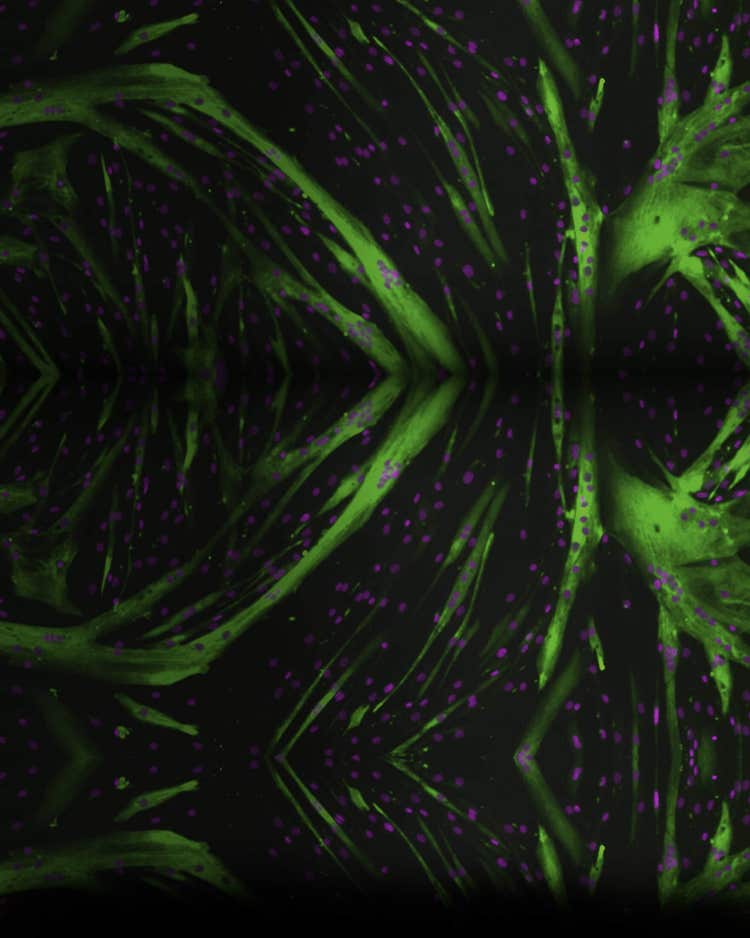
Microscopía digital con adquisición automática de imágenes confocales digitales, de campo brillante y de fluorescencia
El sistema de adquisición automática de imágenes celulares ImageXpress® Pico es más que un microscopio digital; combina la adquisición de imágenes de alta resolución con un potente análisis. Ya sea realizando ensayos en campo claro o adquiriendo imágenes de fluorescencia, el generador de imágenes automático presenta una gama completa de protocolos preconfigurados para ensayos con células para acortar la curva de aprendizaje, de modo que pueda comenzar a realizar experimentos rápidamente. Con funciones como la deconvolución en tiempo real 2D con confocal digital*, autofoco, previsualización en vivo, Cell Scoring con longitud de onda múltiple y el flujo de trabajo opcional del software de análisis de imágenes IN Carta®, el sistema ImageXpress Pico le ofrece la capacidad para avanzar en sus descubrimiento con un generador de imágenes pequeño y asequible.

Introducción rápida
Con el software de adquisición y análisis de imágenes CellReporterXpress® dirigido por iconos y fácil de usar, todo su laboratorio puede optimizar la microscopía digital. Comience a capturar y analizar imágenes con formación mínima.

Haga algo más que contar células
Amplíe sus ensayos con más de 25 plantillas preconfiguradas optimizadas para muchos experimentos con células, como apoptosis, evaluación mitocondrial, modelos celulares 3D, células vivas/lapso de tiempo, puntuación de células con varias longitudes de onda y crecimiento axonal.

Automatice la adquisición de imágenes de forma asequible
Alivie la molestia de ir al laboratorio central para analizar sus muestras. El precio del sistema, asequible para un laboratorio, permite a los investigadores conseguir la comodidad de la adquisición y análisis automáticos de imágenes en la mesa de su laboratorio. Puede pedir el sistema de forma que se ajuste a su investigación con opciones como confocal digital, control del entorno y adquisición Z-stack.
Tour virtual por el sistema de adquisición automática de imágenes ImageXpress Pico
Características

Modos múltiples de adquisición de imágenes
El sistema ImageXpress Pico ofrece objetivos que abarcan desde 4x a 63x y puede funcionar en modos de adquisición de imágenes colorimétricas, de campo claro, de fluorescencia o deconvolución en tiempo real 2D con confocal digital.

Protocolos de análisis preconfigurados
Más de 25 protocolos de análisis preconfigurados que abarcan desde el simple recuento de células al sofisticado análisis de crecimiento axonal. Con funciones como la herramienta “clic para encontrar”, se pueden optimizar los parámetros del análisis simplemente haciendo clic en algunas células que cumplan criterios específicos.

Visualización desde placas a células individuales
Se pueden visualizar los datos a varios niveles, desde la vista general de la placa hasta células individuales. La gran variedad de herramientas de visualización de datos desde la placa y a nivel celular permite a los usuarios obtener toda la información posible de sus imágenes y ensayos.

Adquisición Z-stack
Genere imágenes más nítidas para realizar segmentaciones más exactas con la adquisición Z-stack. Adquiera una serie de imágenes en diferentes puntos focales para capturar más detalles que con un único corte. Los usuarios pueden incluir todos los cortes o seleccionar qué cortes incluir en la proyección final.

Identifique regiones de interés rápida y fácilmente
La previsualización en vivo simplifica la identificación de regiones de interés, lo que permite a los usuarios desplazarse por la muestra y ajustar el enfoque de forma interactiva con un joystick virtual, ahorrando tiempo y esfuerzo.

Control del entorno
Se pueden procesar ensayos con células vivas de lapso de tiempo de varios días utilizando el sistema de control del entorno integrado con opciones de control de humedad, CO2 y O2. El software, optimizado para evitar la deriva Z, también proporciona monitorización en tiempo real del estado del entorno, garantizando unas condiciones óptimas del ensayo.
Experimente la potente combinación de ImageXpress Pico y CellReporterXpress
Soluciones personalizadas de automatización de laboratorios con robótica, incubadores y software
El entorno de investigación está en constante cambio y los científicos de hoy día necesitan acceso remoto simplificado y una mejora en la automatización del laboratorio. Combinando el sistema de adquisición automática de imágenes celulares ImageXpress® Pico con el manipulador de placas S-LAB™ de PAA y el incubador SCILA de Inheco se obtiene una mayor productividad, costes reducidos y un rendimiento uniforme*.
Recursos más recientes
Aplicaciones destacadas
https://main--moleculardevices--hlxsites.hlx.page/fragments/applications/apoptosis-analysis
https://main--moleculardevices--hlxsites.hlx.page/fragments/applications/cancer-research
https://main--moleculardevices--hlxsites.hlx.page/fragments/applications/cardiomyocytes
https://main--moleculardevices--hlxsites.hlx.page/fragments/applications/cell-counting
https://main--moleculardevices--hlxsites.hlx.page/fragments/applications/digital-confocal
https://main--moleculardevices--hlxsites.hlx.page/fragments/applications/live-cell-imaging
https://main--moleculardevices--hlxsites.hlx.page/fragments/applications/stem-cell-research
https://main--moleculardevices--hlxsites.hlx.page/fragments/applications/toxicology
https://main--moleculardevices--hlxsites.hlx.page/fragments/applications/disease-modeling-2
Adelantos para los clientes
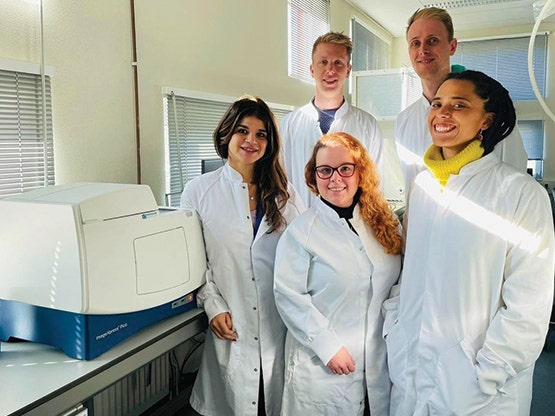
HISTORIA DE ÉXITO
Qorium utiliza el sistema ImageXpress Pico y el lector SpectraMax iD5 como parte del desarrollo de cuero cultivado en laboratorio
¿Cómo podemos ayudarle a avanzar en su próximo gran descubrimiento?
Nuestros equipos altamente calificados están en primera línea con nuestros clientes, realizando demostraciones remotas o in situ de productos, seminarios web y más para ayudarle a resolver los difíciles desafíos de su investigación. ¿Cómo podemos ayudarle hoy?
Me gustaría...
Aplicaciones del sistema de adquisición automática de imágenes celulares ImageXpress Pico
Especificaciones del sistema de adquisición automática de imágenes celulares ImageXpress Pico
Descargar folleto breve

Recursos del sistema de adquisición automática de imágenes celulares ImageXpress Pico
Número de menciones*: 428
Últimas menciones: Si desea una lista completa, haga clic aquí.
*Fuente: https://scholar.google.com/