
Application Note
Identify compound-specific effects on neurite outgrowth using ImageXpress Pico system
- Evaluate compound-specific effects on neurite outgrowth
- Quantitate characterization of the extent and complexity of neural networks by multiplexed measurements
- Utilize assay to study neuronal development and neuronal degeneration in vitro
Introduction
Oksana Sirenko | Sr. Research Scientist | Molecular Devices
Neurite outgrowth is a commonly used assay to study neuronal development and neuronal degeneration in vitro. Development of neurites requires a complex interplay of both extracellular and intracellular signals. The growth of neurites can be stimulated or inhibited by neurotrophic factors. Importantly, the development of neurons can be affected by neurotoxic chemicals.
We evaluated the neurite outgrowth assay on the ImageXpress® Pico Automated Cell Imaging System to measure the ability of compounds to adversely affect the developing nervous system. This assay was selected due to its relevance as a critical process in nervous system development in which neurons extend their neurites to form a complete neural network1,2. Total neurite outgrowth is typically the most common metric reported3,4, while additional parameters, such as total branches and total processes may represent additional modes by which compounds may inhibit neurite outgrowth.
We evaluated compound-specific effects on neurite outgrowth that included quantitative characterization of the extent and complexity of neural networks by multiplexed measurements. Phenotypic readouts for neurite outgrowth were characterized using multiple measurements. Neurite outgrowth was characterized by the extent of the outgrowth (length of total outgrowth or mean outgrowth per cell), the number of neurite processes (total number of processes), and the extent of branching (total number of branches and mean number of branches per cell)
Materials
- iPSC-derived Neurons (Human Neuronal Kit, NEURO KIT, XK-001-1V, XCell Science Company)
- Poly-D-lysine pre-coated 384-well plates (Corning Biocoat)
- Laminin (Sigma-Aldrich)
- Hoechst (ThermoFisher Scientific)
- Hank’s Balanced Salt Solution (Life Technologies)
- ImageXpress Pico Automated Cell Imaging System (Molecular Devices)
- CellReporterXpress ® Image Acquisition and Analysis Software (Molecular Devices)
Methods
iPSC-derived neurons were plated on poly-D-lysine, pre-coated 384-well plates treated with 3.3 mg/mL laminin. Ten thousand cells were plated per well and maintained in iCell Neuron Maintenance Medium for 48 h prior to compound treatment. Neurite networks in these cells typically start to form at 2 h post plating and increase in complexity up to 10–12 days in culture. Neurons were cultured for 14 days as recommended by the manufacturer, then treated for 72 h across a 6-point concentration range (0.3–100 μM) in 384-well plates. Effects on neurite outgrowth were assessed by quantifying total outgrowth, branches, processes, and the number of viable cells per well. Concentration-response dependencies were evaluated using EC50 values.
Cells were exposed to compounds for 72 h at 37°C and 5% CO2. Next, media was removed and cells were fixed with 4% formaldehyde, washed 2x, and then, incubated with a 1:100 mixture of AF-488 conjugated phalloidin, and 1 μm Hoechst 33342 in sterile Hank’s Balanced Salt Solution for 2 h. Calcein AM was used as a marker for neurite outgrowth and cell viability. After incubation, the staining solution was replaced with phosphate buffered saline (PBS) containing 0.1% of Fetal Bovine Serum (FBS) for image capture.
Images from individual wells were acquired with the ImageXpress Pico system using a 10X objective. Typically, one 10X image was captured per well in a 384-well plate. A 10X objective provides sufficient resolution to distinguish neurite networks and subcellular structures in a relatively large number of cells (>200) per image, which represents about 1/6th of the total well area. Analysis was run on-the-fly using CellReporterXpress software, which contains analysis modules for neurite tracing. Figure 1 shows a representative zoomed-in image from DMSO-treated neurons with the neurite tracing overlay.
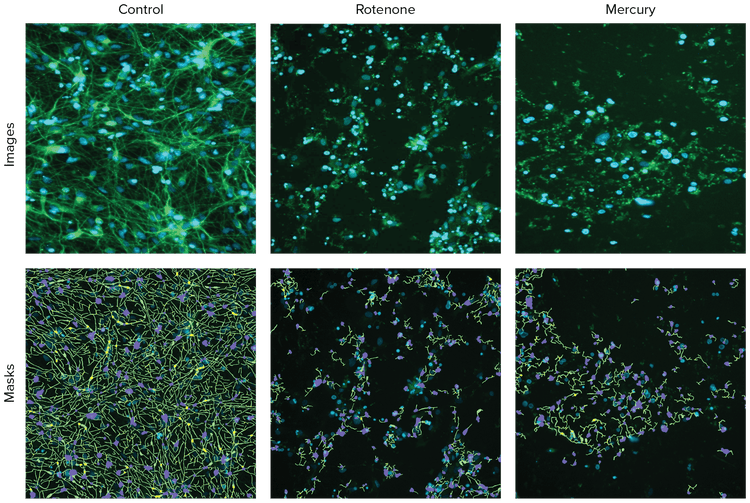
Figure 1. Representative images of neurons with ß-tubulin (green) stain and with CellReporterXpress software analysis traces shown for the control and compound treated cells. XCell neurons were treated with compounds for three days and were then fixed and stained with AF488-conjugated anti-ß-tubulin (TUJ-1) antibodies (1:100). Images were taken by the ImageXpress Pico system using the 10X Plan Fluor objective and FITC and DAPI channels. Images were processed using the Neurite Tracing analysis protocol. Analysis masks show the outgrowths (green), cell bodies (blue), and branching points (pink).
Results
We observed dose-dependent inhibition of the neurite network formation with compound treatment (Figure 2). Quantitative analysis of the images captured in these experiments included the derivation of multiple parameters that allow for the assessment of both morphological features of cultured neurons and the extent and degree of complexity of the neuronal networks. Number of total cell bodies in the image was also quantitated for estimations of compound-induced cytotoxicity. Since cell plating and neurite outgrowth were very consistent and uniform across the experiment, we used total numbers of neurons per image for statistical analysis. Length of outgrowth per cell or numbers of processes or branches per individual cell were also measured but not used for statistical analysis because of redundancy. The toxic effects of compounds can be compared by EC50 values (concentration of compound for 50% inhibition of neurite outgrowth) derived from 4-parametric curve fit for neurite outgrowth, number of branches, processes, or number of viable cells. Figure 2 presents concentration-dependent curves for the total length of neurite networks (total outgrowth) across various compounds (1 μM concentration) to assess their potential neurotoxic effects and prioritize for further toxicity evaluation. Figures 3 and 4 present neurotoxic compounds tested at 10 μM concentrations.
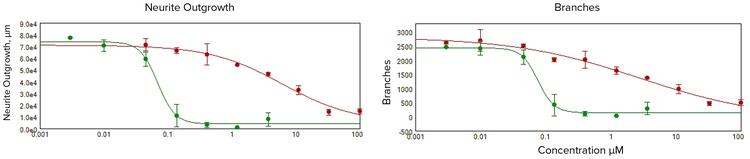
Figure 2. Disruption of neurite networks were measured for neurons treated with 1 μM of indicated compounds. EC50 values were defined by a decrease in total outgrowth, 6 μM for rotenone and 0.07 μM for methyl mercury. EC50 values were defined for decrease of branch points, 3 μM for rotenone and 0.07 μM for methyl mercury.
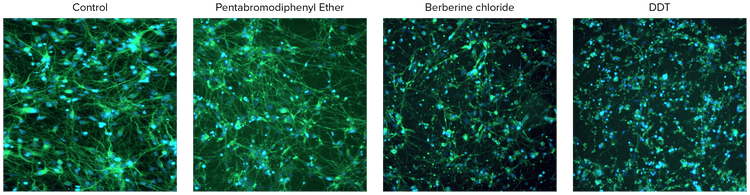
Figure 3. Images of neurotoxic compounds tested at 10 μM concentrations.
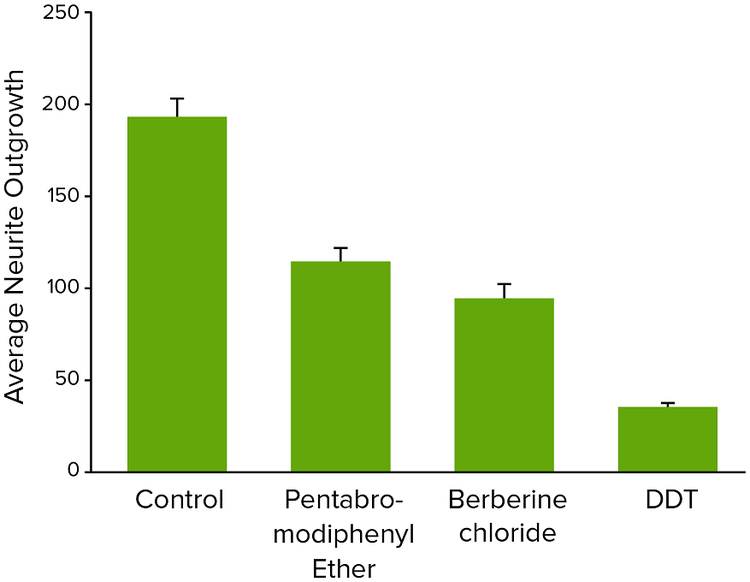
Figure 4. Average neurite outgrowth for neurotoxic compounds tested at 10 μM concentrations.
Conclusion
The assay can be useful for studies of different modulators of neurite outgrowth as well as in vitro neurotoxicity effects.
References
- Harrill, J.A., Robinette, B.L., Freudenrich, T., Mundy, W.R., 2013. Use of high content image analyses to detect chemical-mediated effects on neurite sub-populations in primary rat cortical neurons. Neurotoxicology 34, 61–73.
- Sanes, D.H., Reh, T.A., Harris, W.A., 2006. Development of the Nervous System. Elsevier Academic Press, Burlington, MA.
- Radio, N.M., Breier, J.M., Reif, D.M., Judson, R.S., Martin, M., Houck, K.A., et al., 2015. Use of neural models of proliferation and neurite outgrowth to screen environmental chemicals in the ToxCast Phase 1 library. Appl. In Vitro Toxicol. 1 (2), 131–139.
- Stiegler, N.V., Krug, A.K., Matt, F., Leist, M., 2011. Assessment of chemical-induced impairment of human neurite outgrowth by multiparametric live cell imaging in high-density cultures. Toxicol. Sci. 121, 73–87