
Application Note
Fura-2 QBT Calcium Kit: A homogenous Fura-2 calcium assay
- Larger signal window is provided by quench-based technology
- Assay variability is decreased with removal of wash steps and ratiometric measurement
- Save time and assay costs by removing wash steps
Introduction
Fura-2 dye has long been considered an important tool to measure calcium mobilization in cellular imaging, GPCRmediated intracellular calcium flux, and ion channel activation. This ratiometric dye helps correct for assay inconsistencies in dye loading or cell plating through calculating the fluorescence intensity ratio between bound and free indicators. However washing is required, increasing well-to-well variability and adding time and complexity to each assay.
The Fura-2 QBT™Calcium Kit from Molecular Devices incorporates proven quench based technology with a ratiometric Fura-2 calcium indicator to provide a homogenous assay to minimize cell based variability, while increasing throughput through elimination of cell washing prior to detection. In addition, the Fura-2 QBT CalciumKit excites in the ultraviolet spectrum, enabling researchers to mitigate fluorescent compounds that are excited at 488 nm.
Assay principle
Fura-2 AM is a calcium sensitive indicator that is excited at 340 nm and 380 nm, with emission at 510 nm. The dye undergoes an absorption shift from 380 nm to 340 nm when bound to calcium ions. Figure 1 shows an increase in calcium bound to Fura-2 causes the 340/510 nm emission signal (green) to increase while the 380/510 nm emission signal (orange) decreases. The ratio of the emission signals (inset plot) is calculated to measure the maximum-minimum signal response for the concentration response curves.
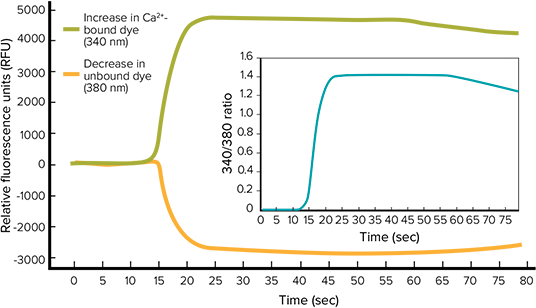
Figure 1. Ratiometric analysis with FURA-2 QBT Calcium Assay. Raw signal changes, in response to changes in the intracellular calcium concentrations, are shown in orange and green. The ratio between the two is shown in the inset.
Fura-2 QBT Calcium Kit assay preparation
Fura-2 QBT CalciumKit, Explorer format (PN #R8197) was used in this study. Dye was resuspended in Hank’s Balanced Salt Solution (HBSS) with 20 mM HEPES. Probenecid (PBX) was added where necessary to inhibit dye leaking out of cells. Adherent CHO M1 or HeLa cells plated the night before, in 384-well black and clear cell plates, were removed from the incubator. 25 µL Fura-2 QBT dye or competitor kit dye loading buffer was added to wells containing 25 µL assay buffer or media. Plates loaded with the Fura-2 QBT Kit (PN #R8197) or BD Ratiometric Calcium Kit (#644243) were incubated one hour at 37°C, 5% CO2. A traditional Fura-2 wash protocol method was also used for comparison studies.
When the traditional Fura-2 wash method was used, media was removed from each well prior to adding 50 µL 1X dye loading buffer then cell plates were incubated using the same time and conditions as other kits. All plates were removed from the incubator and allowed to cool to room temperature 10 minutes prior to being read on either the FlexStation®3 Multi-Mode Microplate Reader or FLIPR®Tetra System. Plates using traditional Fura-2 wash protocol method required washing 3X with HBSS assay buffer to remove excess dye before being read.
Ratiometric calcium mobilization assay on FlexStation 3 reader and FLIPR Tetra System
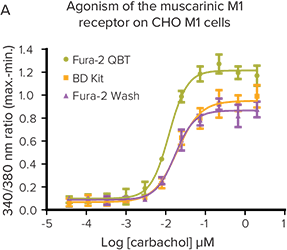
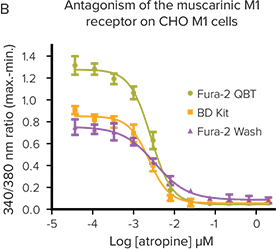
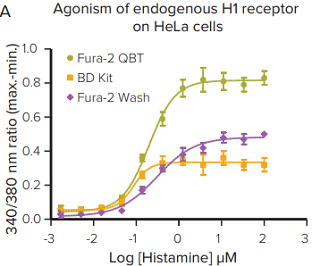
A 5X concentration of appropriate ligand was prepared in HBSS buffer + 20 mM HEPES in 384-well polypropylene plates. Agonist was added during detection on the FlexStation 3reader (Figure 2) or FLIPR TetraSystem (Figure 3) using parameters optimized for a ratiometric assay. Dye excitation was carried out at 340 and 380 nm wavelengths.
Emission signals at 510 nm were detected, then measured in Relative Fluorescence Units (RFU) for both excitation wavelengths in each well for approximately 90 seconds, including during and post addition. Output calculated was the ratio between 340 nm and 380 nm wavelength signals at each time point during the assay. From the ratiometric signal trace, maximum - minimum value was calculated. Data for graphs and EC50/IC50concentrations was exported from ScreenWorks®or SoftMax®Pro Software, then calculated using GraphPad Prism. Z factor calculations were performed using the method described by Zhang, et. al.
Results
EC
50
(nM)
Z @ EC
80
IC
50
(nM)
Z @ EC
80
***Figure 2. Fura-2 QBT Calcium Kit provides the largest signal window.*The kit provides the largest signal window and most robust Z factors at EC80or IC80on the FlexStation 3 reader.
EC
50
(nM)
Z @ EC
80
IC
50
(nM)
Z @ IC
80
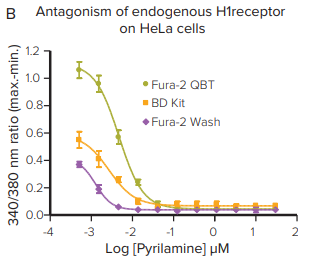
***Figure 3. Fura-2 QBT Calcium Kit assay helps remove assay variability.*The kit further enhances the assay by providing a larger signal window, robust Z factors at EC80or IC80, and removing assay variability by removing wash steps. The assay was measured using the FLIPR Tetra System with UV LEDs.
Conclusion
Fura-2 QBT CalciumKit offers a homogenous alternative to the traditional Fura-2 assay by eliminating the need for washing through use of the Molecular Devices proprietary quench-based technology. This improves throughput, reduces assay variability associated with uneven cell plating or loss of cells during washing, and eliminates assay costs (buffers and requirement for assay repeats due to variability). Compared to BD Ratiometric Calcium Kit and traditional Fura-2 wash assay, the Fura- 2 QBT Calcium Kit provides the largest signal window and strongest Z factors at EC80and IC80. Because the Fura-2 dye excites in the UV range, the kit avoids interference from compounds that autofluoresce when excited at 488 nm. The Fura-2 QBT Calcium Kit is validated for use with the FlexStation 3 reader and FLIPR TetraSystem, providing a scalable solution from a bench top assay to full high throughput screen.
(2) vials of component A*
(1) bottle of dilution buffer (Component B)
* Each reagent vial (Component A) is sufficient for 1 plate (96-, 384-, 1536-well). Each kit is sufficient for 2 plates.
(10) vials of component A*
(1) bottle of dilution buffer (Component B)
* Each reagent vial (Component A) is sufficient for 1 plate (96-, 384-, 1536-well). Each kit is sufficient for 10 plates.
(10) vials of component A*
* Each reagent vial (Component A) is sufficient for 10 plates (96-, 384-, 1536-well). Each kit is sufficient for 100 plates.
Compatible with these Molecular Devices systems
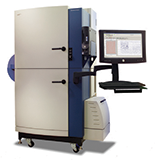
FLIPR®Tetra System
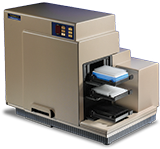
FlexStation®3 Multi-Mode Microplate Reader
前言
Fura-2 染料一直以来被认为是在细胞成像、 GPCR 介导的细胞内钙流、以及离子通道激 活等实验中检测钙动员的重要工具。这种比 值法检测染料通过计算结合和未结合两种 状态之间的荧光强度比值,有助于纠正由于 染料添加或细胞铺板造成的误差。然而,传 统的 Fura-2 染料必须要进行缓冲液清洗,从 而对于每一个实验来说都提高孔间差异性 并需要耗费更多时间且增加操作复杂性。
Molecular Devices®推出的 Fura-2 QBT™钙流 试剂盒是基于专利的信号湮灭技术,含有比值 法检测的 Fura-2 钙离子指示剂,提供均相实 验体系并减小细胞基础的差异性, 从而通过 在检测前去除细胞清洗步骤间接增加通量。另 外, Fura-2 QBT™钙流试剂盒是在紫外光谱处 激发,最大程度使得研究者可以减少 488nm 激发的化合物荧光信号的干扰。
实验原理
Fura-2 AM 是一种钙离子敏感染料,在 340 nm 和 380 nm 被激发,发射波长是 510 nm。 染料结合了钙离子后其吸收波长从 380nm 转 移到 340nm。图 1 显示了钙离子结合 Fura-2 后 340/510nm 发射的信号(绿)的增加,而 380/510 nm 发射的信号(橙)下降。计算两 种发射的信号比值(插图)来检测用于拟合 量效曲线的最大值减去最小值后的信号效 应。

RG ee —— nt AL NETL, I RR 两 和 之 则 的 比值 见 插图
Fura-2 QBT™钙流实验准备
本次实验中使用的是小规格的 Fura-2 QBT™钙 流试剂盒(PN #R8197)。染料重悬在含有 20 mM HEPES 的 Hank’s 平衡盐溶液(HBSS)。 丙磺 舒(PBX)在需要时加入,用以抑制染料被转移 出细胞内。贴别的 CHO M1 细胞或 HeLa 细胞实 验前过夜种在黑壁底透的 384 孔板中,在试验时 从培养箱中取出。含有 Fura-2 QBT 染料或者其 它染料的 25μL 缓冲液加入到每个孔中,同时孔 中需含有 25μL 缓冲液或培养基。加载了 Fura-2 QBT™钙流试剂(PN #R8197)或 BD 比值法钙 流试剂(#644243)的细胞记录板在 37°C、5% CO2 孵育一小时。为便于对比,采用了传统的 Fura-2 清洗方法。
按照此传统的 Fura-2 清洗方法,在加入 50µL 的 1X 染料缓冲液之前去除每个孔中的培养基,然后 去其它试剂盒一样细胞记录版在同样的条件和时 间下进行孵育。在 FlexStation®3 微孔读板机或 FLIPR® Tetra 系统上开始记录前,所有记录板从 培养箱中取出并降温至室温 10 分钟。采用了传统 Fura-2 清洗方法的记录板需要在开始记录前 用 HBSS 实验缓冲液清洗 3 次以去除多余的染料。
FlexStation 3 和 FLIPR Tetra 系统上的比值法钙流 检测实验
在 384 孔的聚丙烯化合物板中将 5 倍浓度的相应 配体溶于含 20mMHEPES 的 HBSS 缓冲液中。 在 FlexStation3(图 2)或 FLIPRTetra系统(图 3) 检测过程中加入激动剂,仪器参数进行了优化以 适应于比值法检测实验。染料的激发波长是 340nm 和 380nm。在 510 nm 检测到发射信号,每个孔中 两个激发波长下的相对荧光单位(RFU)的记录持 续大约 90 秒,包括加样前和加样后。实验中每个采 样时间点的计算后的输出结果是340nm 与 380nm 波 长信号的比值。最大值减去最小值的计算来源自比 值信号曲线。量效曲线和 EC50/IC50 浓度统计计 算所需的数据从 ScreenWorks®或 SoftMax® Pro 软件中输出, 然后用 GraphPad Prism 进一步拟合 和计算。 根据 Zhang, et. al 发表的方法进行.Z 值的计算。
Results 结果

EC
50
(nM)
Z @ EC
80

IC
50
(nM)
Z @ EC
80
Fora2 QBT™YSS CG AME NE 5 BH IDLIREE EC i Cy FARE 7 值

EC
50
(nM)
Z @ EC
80

IC
50
(nM)
Z @ IC
80
量效曲线和 EC50/IC50 浓度统计计 算所需的数据从 ScreenWorks®或 SoftMax® Pro 软件中输出, 然后用 GraphPad Prism 进一步拟合 和计算。 根据 Zhang, et. al 发表的方法进行.Z 值的计算。
Conclusions 结论
相对于传统 Fura-2 实验,Fura-2 QBT™钙流试剂盒提供了均相的实验体系,通过使用 Molecular Devices 公司基于信号湮灭的 专利技术无需再对细胞进行冲洗。因此将提高通量、减小细胞铺板或冲洗时细胞丢失等造成的实验差异性,并节省了实验成 本(因为差异性而需要重复实验带来的缓冲液和耗材)。相比于 BD 比值法钙流试剂盒(#644243)传统的 Fura-2 细胞冲洗实 验,Fura-2 QBT™钙流试剂盒可得到最大的信号窗口以及在 EC80 或 IC80 下最好的 Z 值。因为 Fura-2 燃料在紫外范围激发, 从而避免了化合物 488nm 激发的自发荧光的干扰。Fura-2 QBT™钙流试剂盒在 FLIPRTetra 系统和 FlexStation 3 微孔板检测 平台上进行了充分的验证,提供了可重复、可量化操作的解决方案,适合于高通量的筛选工作。