
Application Note
Measuring cell proliferation using the CyQUANT Cell Proliferation Assay with SpectraMax Microplate Readers
- Rapid and convenient quantitation of cell growth
- Sensitive detection of as few as 50 cells
- Easy data analysis with preconfigured SoftMax Pro Software protocol
Introduction
Quantitation of cell proliferation using fluorescence allows one to easily monitor the effects of drugs and other experimental treatments on cell growth. The CyQUANT Cell Proliferation Assay Kit from Life Technologies is a sensitive, rapid and convenient way to quantitate cell growth using a fluorescence microplate reader. CyQUANT GR dye binds to cellular nucleic acids, allowing cell numbers to be calculated from a standard curve. Because DNA-to-RNA ratios can vary over the course of the cell cycle, the CyQUANT kit allows users to determine cell numbers using RNase-digested cell lysates and a nucleic acid standard curve.
This application note describes how to use the CyQUANT kit with SpectraMax® Microplate Readers and SoftMax® Pro Software from Molecular Devices. Two methods are detailed. In the first, cellular proliferation is quantitated using a cellbased standard curve. In the second, cellular proliferation is quantitated using RNase-treated cell samples and a DNA standard curve.
Materials
- CyQUANT Cell Proliferation Assay Kit (Life Technologies cat. # C7026): Component A, CyQUANT GR dye at 400X; component B, cell-lysis buffer at 20X; and component C, λ DNA standard, 100 µL of a 100 µg/mL solution
Note: Lysis Buffer and CyQUANT GR should be used within a few hours of being diluted. Be sure to protect the CyQUANT GR solution from light. - Cells: CHO-K1 cells were used to generate the data in this application note (ATCC # CCL-61)
- EDTA if using a DNA standard curve (Fisher Chemicals cat. # S311-100)
- NaCl if using a DNA standard curve (Fisher Chemicals cat. # S271-500)
- DNase-free RNase A or RNase cocktail (Ambion cat. # 2286)
- Black 96-well clear-bottom microplates (Corning cat. # 3603)
- SpectraMax microplate reader with fluorescence detection mode (Molecular Devices)
Cell preparation
Adherent or non-adherent cells were prepared for the CyQUANT assay by growing and freezing them directly in the microplate(s) in which they were to be assayed, or by growing them in culture vessels, then freezing pelleted samples of the cells to be transferred to microplates for assay. Please refer to the CyQUANT Cell Proliferation Assay Product Information sheet MP-7026 from Life Technologies for details1.
Method for performing the CyQUANT assay using a cell-based standard curve
Prepare cells to be assayed for proliferation
Step 1: Detach adherent cells from the culture plate using a trypsin or EDTA solution and use culture medium to dilute the cell suspension into a 96-well microplate, making the cell concentrations (number of cells/well) shown in the template setup in Table 1. Include a set of control wells without cells.
Table 1. Cell concentration (number of cells) prepared in a microplate.
Step 2: Incubate the microplate at 37°C for the desired time after which proliferation will be assayed. The incubation time will depend on the type of proliferation assay being performed, the cell type being used and the user’s particular experimental design.
Step 3: Gently aspirate culture medium from wells. The wells may be washed gently with phosphate buffered saline (PBS), but this is not essential and is not recommended for very dense cultures where cells may dislodge.
Step 4: Freeze the cells in the microplate at -70°C until ready to assay (at least one hour, up to four weeks). This freezing step ensures complete lysis of cell samples.
Prepare cells for the standard curve
Note: It is best to use the same type of cell for the standard curve as was used in the experiment.
Step 1: Detach adherent cells from the culture plate using trypsin or EDTA solution, and prepare a concentrated cell suspension in culture medium. Cells should be at a density of about 105 to 106 cells/mL.
Step 2: Centrifuge 1.0 mL of the cell suspension for 5 minutes at about 200 x g (approximately 1500 rpm in a microcentrifuge). Discard the supernatant and freeze the cell pellet at -70°C until ready to assay. This freezing step ensures complete lysis of the cells.
Prepare the assay reagents
Step 1: Dilute the concentrated cell-lysis buffer stock solution 1:20 with distilled water (prepare 200 µL per well) to make 1X cell-lysis buffer.
Step 2: Prepare 1X working solution of CyQUANT GR dye/cell-lysis buffer by diluting the concentrated CyQUANT GR stock solution 1:400 with 1X cell-lysis buffer. This solution should be prepared in a plastic container rather than glass (see CyQUANT product insert).
Prepare cell-based standard curve and unknowns
Step 1: Thaw the previously prepared frozen cell pellet at room temperature for a few minutes. Add 1.0 mL of CyQUANT GR dye/cell-lysis buffer and resuspend the cells by vortexing briefly. Assuming the pellet contained 106 cells, the resulting cell lysate contains the equivalent of 106 cells/mL.
Step 2: Generate a dilution series in the wells of a microplate, starting at 50,000 cells/well and making serial 1:2 dilutions down to 24 cells/well. Use CyQUANT GR dye/cell-lysis buffer to make dilutions such that the desired cell number is in a volume of 200 µl. Prepare four replicates of each standard, and include a set of replicates without cells as a control (you can omit one of the standards, e.g., 781 cells/well, to make room on the microplate).
Step 3: Incubate the microplate at room temperature for 2-5 minutes, protected from light.
Set up the instrument and software
Step 1: Turn on the microplate reader. Launch the SoftMax Pro software and open the CyQUANT Fluorescence protocol located in the Cell Growth & Viability folder in the Protocol Library.
Step 2: Use the instrument settings indicated in Table 2. These settings are already selected for you in the preconfigured protocol.
Table 2. Microplate reader settings. SpectraMax M5 reader settings are shown. Use similar settings for other Molecular Devices readers with fluorescence detection mode.
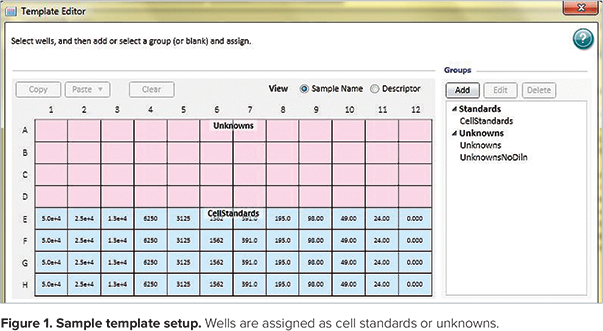
Step 3: Use the Template Editor in the cell standards section of the protocol to create a template of the assay indicating the location of standards (cell numbers for each dilution), blanks (no cell lysate) and unknowns in the microplate. An example of a template with standards and unknowns is shown in Figure 1. Please note that this is the view of the template setup window that appears when the Ctrl and Shift keys are held down simultaneously to display the values assigned to each well. The assigned names of unknowns (Un01-Un12) do not appear in this view.
Step 4: Place the microplate in the microplate reader. If your microplate reader requires an adapter for top reading (e.g. SpectraMax M5), place the adapter in the plate carriage.
Step 5: Click the software’s Read button. The instrument will read the plate, then the relative fluorescence units (RFUs) will be displayed in the Plate section of SoftMax Pro Software.
Analyze the data
Step 1: After the microplate has been read, the data will be analyzed in the Group table that was automatically created when you set up the template.
Step 2: A standard curve is automatically plotted by the software, as long as wells were assigned to the Standards group in the Template Editor. Choose the appropriate curve fit from the drop-down Curve Fit menu in the Graph section. When plotting the standard curve for this application note, we used a log-log curve fit (Figure 2). The quadratic curve fit may also be suitable.
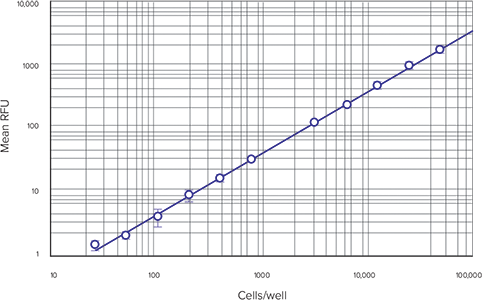
Figure 2. Cell-based standard curve. Cell densities (from 25 to 50,000 cells per well) were assayed.
Step 3: Determine the number of cells per well for experimental cell samples (unknowns). The SoftMax Pro CyQUANT assay protocol calculates these values from the cell-based standard curve and lists them in the Concentration column of the Unknowns group section.
Results for cell-based standard curve
A cell-based standard curve, set up as described above, is shown in Figure 2. A log-log curve fit was used when graphing the standard curve over the entire dynamic range of the assay. Results shown are from the SpectraMax M5 microplate reader, but similar results are obtained with other Molecular Devices readers with fluorescence detection mode (data not shown).
Table 3 shows sample cell proliferation assay results for CHO-K1 cells plated according to the scheme in Table 1 and allowed to proliferate in culture for two days. Cells/well on day two were calculated with SoftMax Pro using the cellbased standard curve.
Table 3. Example of unknowns group data. Mean concentration (cells/well) of cells was calculated two days after plating.
Method for performing the CyQUANT assay using DNAbased standard curve and RNase-treated cells
Cell proliferation can also be assayed based on DNA content using a DNA standard curve. The standard curve can serve to quantitate cellular DNA, provided the cell lysates are pretreated with DNasefree RNase to prevent the RNA from contributing to the fluorescent signal. In this application note, instructions are provided for setting up the DNA standard curve and RNase-treated cell samples.
Prepare the assay reagents
Step 1: Dilute the concentrated cell-lysis buffer stock solution 1:20 with distilled water (prepare 200 µL per well) to make 1X lysis buffer work solution. Prepare two types of 1X lysis buffer: one with a final concentration of 1mM EDTA and 180 mM NaCl and one without EDTA or NaCl.
Step 2: Prepare 1X and 2X working solutions (100 µL per well) of CyQUANT GR dye/cell-lysis buffer by diluting the concentrated CyQUANT GR stock solution 1:400 or 1:200, respectively, with working strength cell-lysis buffer. This solution should be prepared in a plastic container rather than glass, as recommended by Life Technologies.
Prepare a DNA standard in plastic tubes
Step 1: Dilute the 100 µg/mL DNA standard from the kit in 1X CyQUANT GR dye/cell lysis buffer to make a 1 µg/mL stock solution.
Step 2: Dilute the 1 µg/mL stock solution further to make a dilution series as shown in Table 4.
Table 4. Preparation of DNA standards. DNA was diluted as indicated to make standards from 10 to 1000 ng/mL, plus blank.
Note: The CyQUANT kit includes a λ bacteriophage DNA standard. The data shown in this application note were generated using this standard, prepared in serial dilutions. Depending upon the assay you are running, you may wish to use the kit’s DNA standard or another DNA that is more appropriate for your sample, prepared according to the instructions in the Product Information sheet MP-7026.
Prepare the cells
Choose the appropriate set of culture and freezing instructions from Life Technologies’ CyQUANT Product Information sheet for the type of cells (adherent or non-adherent) and growing conditions (in microplates or culture vessels). Freeze the cells at -70°C. For this application note, adherent cells were trypsinized to detach them from the culture vessel, then pelleted and frozen. Samples containing known numbers of cells were used to demonstrate assay performance.
Prepare the cell samples, standard curve DNA samples and blanks
Step 1: Remove the previously prepared frozen cell pellets (or microplate) from -70°C storage. Thaw the frozen cells at room temperature for a few minutes.
Step 2: Pre-treat the cells with RNase by adding 100 µL 1X cell-lysis buffer containing 180 mM NaCl and 1 mM EDTA to each well and to four wells without cells (blanks). If using previously pelleted cells, resuspend each sample in 100 µL and transfer to the wells of a microplate. Add 4 µL of RNase (two units per well; see note below) into each well containing cells as well as the control wells without cells. Incubate at room temperature for one hour.
Note: DNase-free RNase should be used at a concentration such that no more than 10 µL contains the full number of units needed to treat a sample. For example, the RNase Cocktail from Ambion has 500 U/mL activity, so 4 µL per well equals two units per well.
Step 3: Add 100 µL of 2X CyQUANT GR dye/cell-lysis buffer to each of the microplate wells, including the control wells without cells.
Step 4: Prepare the DNA standard curve by transferring the previously prepared DNA serial dilutions into the appropriate wells of the microplate, as defined in the template editor. The plate should contain two controls: a digest control prepared following the same steps as the cellular samples, but without cells (no DNA), and a standard curve control/plate blank containing only 200 µL 1X CyQUANT GR dye/cell-lysis buffer (no DNA and no RNase).
Step 5: Incubate the samples for 2–5 minutes.
Set up the instrument and software
Step 1: Turn on the microplate reader. Launch the SoftMax Pro software and open the CyQUANT Fluorescence protocol in the Cell Growth & Viability folder of the Protocol Library.
Step 2: Use the instrument settings indicated in Table 2. These settings are already selected for you in the preconfigured protocol.
Step 3: Use the Template Editor in the DNA standards section of the protocol to create a template of the assay showing where standards, unknowns (cells treated with RNase), and plate blanks will be located on the microplate.
Read the plate and analyze the data
Step 1: Place the microplate in the reader.
Step 2: Read the plate.
Step 3: After the microplate has been read, the RFUs will be displayed in the Plate section. The data will be analyzed in the Group tables that you created while setting up the template.
Step 4: The DNA standard curve will be plotted automatically, as long as wells were assigned to the appropriate group in the Template Editor.
Step 5: Choose the appropriate curve fit from the drop-down Curve Fit menu in the Graph section. We used a log-log curve fit for this experiment.
Step 6: Cellular DNA concentrations will be interpolated automatically from the DNA standard curve and displayed in the Unknowns group table.
Results for DNA standard curve
A typical DNA-based standard curve is shown in Figure 3. The SpectraMax M5 microplate reader was used to generate these data, but similar results are obtained on other Molecular Devices readers with fluorescence detection mode (data not shown). An example of the calculation of cellular DNA concentrations in RNasetreated cells from a DNA standard curve is shown in Table 5. For this application note, a serial cell dilution was used as unknowns. In fact, any number of cells between 50 and 50,000 cells/well (in the linear range of the standard curve) can be detected and cellular DNA value can be obtained using this method.
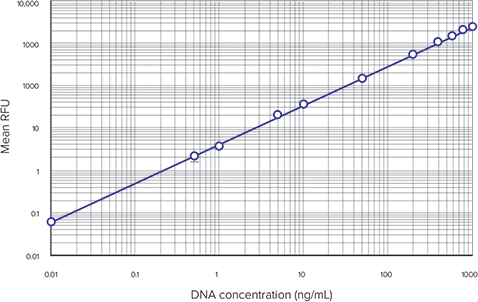
Figure 3. DNA standard curve. DNA standard curve obtained using the CyQUANT assay kit.
Table 5. Sample group table: Cellular DNA concentrations calculated by SoftMax Pro Software using DNA standard curve. Replicates are not presented in this view of the group table.
Figure 4 shows the average cellular DNA in each set of samples versus the number of cells/well. The linear range of the assay under these conditions is from 50 to 50,000 cells, as expected based on the Product Information sheet MP 7026. A comparison of RFUs in RNase-treated and untreated cell samples is shown in Figure 5 and demonstrates that RNase treatment reduces the amount of fluorescence in the cell lysates.
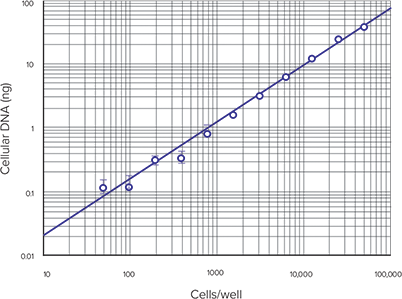
Figure 4. Cellular DNA vs. cells-per-well. Cellular DNA concentration vs. number of RNase-treated cells per well.
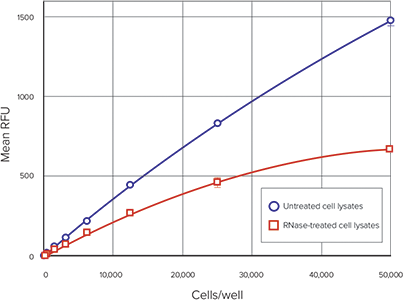
Figure 5. Comparison between RNase-treated and untreated cells. RFU vs. Cells/well for RNasetreated cells compared to untreated cells. Blue circles, untreated cell lysates; red squares, RNasetreated cell lysates.
Conclusions
The CyQUANT Cell Proliferation Assay is a quick, sensitive fluorescence method for quantitating cell numbers or cellular DNA content. Assay results are similar on the SpectraMax M5 or other Molecular Devices readers with fluorescence detection mode. Using a cell-based standard curve and a five-minute incubation, we observed a limit of detection and dynamic range similar to that described in the CyQUANT Product Information sheet (50-50,000 cells per sample). Using a DNA standard curve generated with the λ DNA standard provided with the kit, we were able to calculate the amount of DNA in as few as 50 cells. The analysis capabilities of SoftMax Pro Software, along with a preconfigured CyQUANT protocol, provide a convenient method for calculating and reporting the data.
Reference
- Life Technologies Product Information sheet MP 7026 1/12/01: CyQUANT Cell Proliferation Assay Kit (C-7026).