
Application Note
HTRF cAMP dynamic 2 and IP-One assays on the SpectraMax M5e reader
- Flexibility of a dual monochromator-based system
- Wide dynamic ranges and excellent Z’ factors
- Preconfigured HTRF protocols with SoftMax Pro Software
Introduction
The SpectraMax®M5e Multi-Mode Microplate Reader is a dualmonochromator capable of fluorescence, time-resolved fluorescence (TRF), fluorescence polarization, absorbance, and luminescence assays. It offers the additional advantage of HTRF®(homogeneous time-resolved fluorescence) certification, allowing life sciences and drug discovery researchers to increase their productivity through greater flexibility in TRF detection.
HTRF is a versatile technology developed by Cisbio for detecting molecular interactions between biomolecules.1Combining the features of fluorescence resonance energy transfer (FRET) and TRF, it uses Europium (Eu) cryptate as its donor fluorophore and a modified allophycocyanin (XL665) or the small molecule d2 as the acceptor fluorophore. When interacting biomolecules are labeled with Europium cryptate and d2, FRET takes place between the donor and the acceptor fluorophores, resulting in fluorescence emission monitored at 665 nm, while most of the excitation energy of the cryptate is released as fluorescence emission at 620 nm. Well-to-well variability is corrected by using Cisbio’s patented HTRF ratio calculation, which utilizes the ratio of the 665 nm and 620 nm fluorescent signals.
HTRF assay performance on the SpectraMax M5ereader is demonstrated here with two different HTRF assay kits, cAMP dynamic 2 and IP-One. G-protein coupled receptors signal through two major pathways, regulation of cAMP and increase in intracellular calcium levels mediated by IP3. With the cAMP dynamic 2 kit, cAMP levels are detected using a Eu cryptate-labeled monoclonal anti-cAMP antibody and d2-labeled cAMP. Native cAMP produced by cells competes with cAMP-d2 for binding to anti-cAMP antibody-cryptate. An increase in cellular cAMP leads to a decrease in FRET that is detectable as a decrease in the fluorescence at 665 nm. The IP-One assay has a similar format and uses a monoclonal antibody specific to IP1, a more stable downstream metabolite of IP3 that accumulates in signaling cells in the presence of lithium chloride. Fluorescence at 665 nm is inversely proportional to the concentration of IP1 in the calibrator or cell lysate. This application note presents both cell-based assay data and standard curves generated with the cAMP dynamic 2 and IP-One kits. These HTRF data demonstrate the excellent dynamic range and Z’ factors2obtainable with the SpectraMax M5e reader.
Materials
- cAMP dynamic 2 kit, 1000 tests (Cisbio cat. #62AM4PEB)
- IP-One kit, 1000 tests (Cisbio cat. #62IP1PEB)
- Cell line: CHO-M1 (M1WT3; ATCC cat. #CRL-1985)
- Forskolin (Sigma cat. #F3917)
- 3-isobutyl-1-methylxanthine (IBMX; Sigma cat. #I7018)
- Carbamoylcholine chloride (carbachol; Sigma cat. #C4382)
- White 384-well microplates (Corning cat. #3705)
- SpectraMax M5e Multi-Mode Microplate Reader (Molecular Devices)
Note: Always use white microplates when performing HTRF assays on the SpectraMax M5ereader. To optimize signal detection, use solid white microplates rather than clear-bottom ones.
Methods
cAMP dynamic 2 assay
CHO-M1 cells were grown in Ham’s F12 medium supplemented with 10% FBS, 1% penicillin/streptomycin/L-glutamine, and 200 µg/mL G418. The cAMP dynamic 2 assay was performed on cells in suspension. Cells were trypsinized the day of the assay, resuspended in Ham’s F12 medium without additives, and seeded at 4,000 cells per well in a volume of 10 µL per well in a white 384-well microplate. To stimulate cAMP production, cells were treated with 10 µL of forskolin at final concentrations of 3 nM to 1 mM for one hour prior to addition of detection reagents. IBMX was added to assay wells at 0.5 mM to inhibit phosphodiesterasemediated cAMP degradation.
After one hour of forskolin treatment, cAMP-d2 in conjugate and lysis buffer, and anti-cAMP antibody-cryptate, were added to the cells as described in the product insert. A cell negative control containing untreated cells received anticAMP antibody-cryptate and conjugate and lysis buffer without cAMP-d2. This FRET-negative control was necessary for calculating Delta F values as outlined in the HTRF package insert3. The final assay volume for all samples and standards was 40 µL, but assay volume can be adjusted for different microplate types.
Standards for cAMP were prepared as indicated in the cAMP dynamic 2 HTRF package insert. Final concentrations of cAMP ranged from 0.17 to 712 nM, and a positive control without cAMP (maximum FRET) was included. A cAMP control consisting of free cAMP was used to monitor assay activity, and a negative (no-FRET) control without cAMP or cAMP-d2 was used to calculate Delta F. cAMP-d2 was added to all standards and to the positive control, while the negative control received conjugate and lysis buffer without cAMP-d2. Anti-cAMP antibodycryptate was added to all standards and controls. After a one-hour incubation at room temperature, the microplate was read on the SpectraMax M5e reader. (See Table 1 for instrument settings.)
IP-One assay
CHO-M1 cells were cultured as described above. Cells were seeded into 384-well microplates at 10,000–40,000 cells per well in complete growth medium the day before the assay. The next day, cells were stimulated with carbachol concentrations ranging from 15 nM to 33 µM (stimulation buffer containing lithium chloride was used to prepare carbachol concentrations). After a one-hour stimulation, IP1-d2 in conjugate and lysis buffer, and anti-IP1 antibodycryptate, were added to the wells. A cell negative control containing untreated cells received anti-IP1 antibody-cryptate and conjugate and lysis buffer without IP1-d2. The final assay volume was 40 µL, but as with the cAMP assay, this volume can be adjusted for different microplate types.
IP1 standards with final concentrations ranging from 21.5 to 22,000 nM were prepared by diluting reconstituted IP1 standard in stimulation buffer as indicated in the IP-One HTRF package insert.4A positive IP1 and a negative control without IP1 were included. IP1-d2 was added to all standards and to the positive IP1 control, while the negative control received conjugate and lysis buffer without IP1-d2. Anti-IP1 antibody-cryptate was added to all samples. After incubating for one hour at room temperature, the microplate was read on the SpectraMax M5ereader with the settings indicated in Table 1.
Time Resolved
Delay: 50
Integration: 400
Top Read
| Table | ||
|---|---|---|
| Ex | Em | Cutoff |
| 314 | 620 | 570 |
| 314 | 668 | 630 |
Readings: 100
PMT: Auto
Table 1. Instrument settings for SpectraMax M5e reader
Data analysis
Data from both cAMP and IP-One assays were analyzed according to Cisbio’s guidelines, using SoftMax®Pro Software. Four different ready-to-use HTRF protocols in SoftMax Pro Softwarehave been designed to simplify data acquisition and analysis for all types of HTRF assays currently available.
FRET was calculated as follows:
Ratio=(Signal665nm/Signal620nm) x 10000
Delta Ratio=Standard or Sample Ratio - Rationeg
(where Rationegis the ratio for the negative control)
Delta F%=(Delta R/Rationeg) x 100
Instrument settings
Wavelength, delay and integration settings have been optimized for the dual monochromator-based SpectraMax M5e reader. Most notably, the best emission wavelength for XL665/d2 donor was determined to be 668 nm rather than 665 nm as indicated in HTRF product information.
Results
Best results were obtained from cAMP cell-based assays using about 4,000 CHOM1 cells per well in a 384-well microplate (40 µL final assay volume). Optimal cell density may vary according to cell type and specific assay conditions. A one-hour treatment of the cells with forskolin yielded a dose-response curve with an EC50of 11.4 µM and Z’ factor of 0.86 (Figure 1). Delta F% values calculated using Cisbio’s ratiometric formulas ranged from 47 to 707 (Table 2), similar to the range observed for the cAMP standard curve (Figure 2, Table 3).
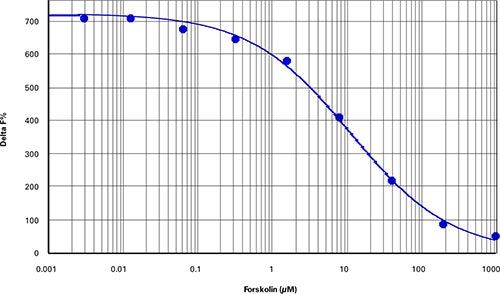
Figure 1. cAMP cell-based assay. Forskolin dose-response in CHO-M1 cells (Z’=0.86, EC50=11.4 µM).
Table 2. Summary of cAMP cell-based assay data
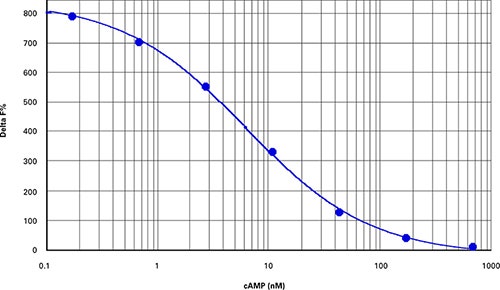
Figure 2. cAMP standard curve. cAMP standard curve (Z’=0.84, EC50=6.3 nM, comparable to the value indicated in the package insert).
Table 3. Summary of cAMP dynamic 2 assay standard curve data.
In IP-One cell-based assays, optimal cell density was determined as 10,000 CHOM1 cells per well of a 384-well microplate (40 µL final assay volume). A one-hour stimulation with carbachol yielded a doseresponse curve with an EC50of 0.64 µM and Z’ factor of 0.91 (Figure 3). Delta F% values calculated using Cisbio’s ratiometric formulas ranged from 3402 to 12539. (Table 4).
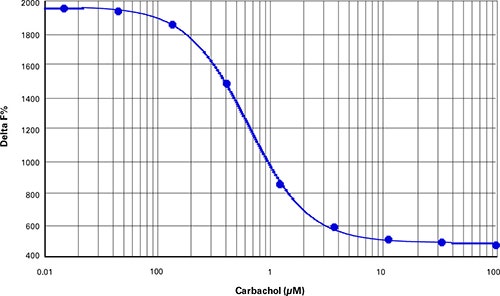
***Figure 3. IP1 cell-based assay.*Carbachol dose-response curve in CHO-M1 cells (Z’=0.91, EC50=0.64 µM carbachol).
Table 4. Summary of IP-One cell-based assay data.
Preparation of IP1 standards as directed in the IP-One HTRF package insert produced a calibration curve with a Z’ factor of 0.84 (Figure 4) and Delta F% values ranging from 820 to 11883 (Table 5).
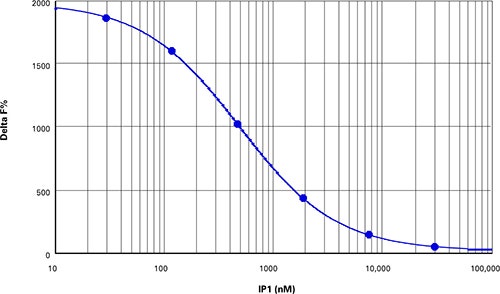
Figure 4. IP1 standard curve. Z’=0.84, EC50=501 nM, comparable to the value indicated in the package insert.
Table 5. Summary of IP-one standard curve data.
Conclusion
The SpectraMax M5eMulti-Mode Microplate Reader with HTRF certification expands the range of assay methods available to researchers who want the flexibility of a dual monochromator-based system and the versatility of multiple detection modes. IP-One and cAMP HTRF assays, when run on the SpectraMax M5e reader, exhibit wide dynamic ranges and excellent Z’ factors ranging from 0.78 to 0.91. Data analysis is simplified using SoftMax Pro Software with preconfigured HTRF protocols.
References
- TR-FRET Basics (HTRF Technology)
- Zhang, J. H., Chung, T. D. Y., and Oldenburg, K. R. (1999). A simple statistical parameter for use in evaluation and validation of high throughput screening assays. J. Biomol Scrn 4(2): 67-73.
- cAMP dynamic 2 HTRF kit package insert (Cisbio international, France).
- IP-One HTRF kit package insert (Cisbio international, France).
Learn more about SpectraMax M Series Multi-Mode Microplate Readers >>
简介
SpectraMax® M5e多功能微孔板读板机具 有双单色器,能够进行荧光、时间分辨荧 光(TRF)、荧光偏振、光吸收和化学发光 检测。它具有HTRF®(均相时间分辨荧光) 认证的优势,使得生命科学和药物发现研 究者们通过TRF检测的高度灵活性提高产 出。
HTRF®是Cisbio Bioassays公司开发的一 项检测生物分子相互作用的多用途技术 1。此技术结合了荧光共振能量转移 (FRET)和TRF的特点,采用铕(Eu)的穴状 化合物作为供体荧光基团和一种经过修饰 的别藻蓝蛋白(XL665)或小分子d2作为受 体荧光基团。当标记了铕穴状化合物和d2 的生物分子相互作用时,FRET就会在供体 和受体荧光基团间发生,可在665nm处检 测到荧光发射,此时大部分穴状化合物的 激发能量都以620nm荧光发射释放出来。 孔与孔之间的差异通过利用Cisbio专利的 HTRF比值算法校正,此算法使用的是 665nm和620nm的荧光信号比值。
HTRF测定在SpectraMax M5e读板机上的 表现通过使用两种不同的HTRF检测试剂 展示。G-蛋白偶联受体信号转导通过检测 两种主要通路,cAMP的调控和IP3介导的 胞 内 钙 离 子 水 平 增 加 。 利 用 c A M P dynamic 2试剂中Eu的穴状化合物标记的 单克隆抗-cAMP抗体和d2-标记的cAMP进 行检测。 由细胞本身产生的cAMP与cAMP-d2竞争 结合抗-cAMP抗体穴状化合物。细胞内 cAMP的增加导致FRET降低,检测到的 665nm荧光下降了。IP-One测定采用相似 的方式并使用IP1特异的单克隆抗体,一 种稳定的在氯化锂存在下富集于信号转导 细胞中的IP3下游代谢产物。665nm荧光 与IP1浓度在校准品或细胞裂解物中成反 比。这篇应用文献展示了两种基于细胞的 检测数据和由cAMP dynamic 2和IP-One 试剂盒得到的标准曲线。这些HTRF数据 揭示了在SpectraMax M5e读板机上得到 的完美动态范围和Z’因子。
材料
- cAMP dynamic 2 试剂盒,1000个测试 (Cisbio cat. #62AM4PEB)
- IP-One 试剂盒, 1000个测试 (Cisbio cat. #62IP1PEB)
- 细胞系:CHO-M1 (M1WT3; ATCC cat. #CRL-1985)
- 福斯高林(Sigma cat. #F3917)
- 3-异丁基-1-甲基黄嘌呤(IBMX; Sigma cat. #I7018)
- 3-异丁基-1-甲基黄嘌呤(IBMX; Sigma cat. #I7018)
- 白色384-孔微孔板 (Corning cat. #3705)
- SpectraMax M5e多功能微孔板读板机 (Molecular Devices)
注意:通常在SpectraMax M5e上检测HTRF使 用的是白色微孔板。为优化信号检测,使用不 透明白色微孔板而非底透板。
方法
cAMP dynamic 2测定
CHO-M1细胞生长于添加了10% FBS、1% 青霉素/链霉素/谷氨酰胺和200 µg/mL G418的Ham F12培养基中。使用悬浮细 胞进行cAMP dynamic 2测定。细胞于测 定当天进行胰酶消化,重悬于无添加的 Ham F12培养基中,并以每孔4,000细胞、 10 µL体积接种于白色384-孔微孔板中。 为了刺激cAMP产生,添加检测试剂前用 10 µL终浓度为3 nM到1 mM福斯高林处理 处理细胞一小时。测试孔中加入0.5 mM IBMX以抑制磷酸二酯酶介导的cAMP降 解。
福斯高林处理一小时后,按照产品说明书 中所述加入cAMP-d2、裂解缓冲液和抗 -cAMP抗体-穴状化合物。细胞阴性质控包 含接受了抗-cAMP抗体-穴状化合物、偶联 物及不含cAMP-d2的裂解缓冲液的未处理 细胞。FRET阴性质控对Delta F值的计算 是必要的,其在HTRF产品说明书中有所 强调3。所有样品和标准品的最终测定体 积为40 µL,但是测定体积可以针对不同 微孔板类型调整。
标准品按照cAMP dynamic 2 HTRF产品说 明书所述准备。cAMP终浓度从0.17到 712 nM,并且包括不含cAMP(最大FRET)的阳 性质控。包含自由cAMP的质控用于检测 测定的活性,不含cAMP或cAMP-d2的阴 性质控(无FRET)用于计算Delta F。 cAMP-d2添加于所有标准品和阳性质控 中,而接受有偶联物的阴性质控和裂解缓 冲液没有cAMP-d2。抗-cAMP抗体-穴状化 合物添加于所有标准品和质控中。室温下 孵育一小时后,在SpectraMax M5e读板机 上进行微孔板读数。(请见表1 仪器设置)。
IP-One测定
CHO-M1细胞按上述方法培养。在测定前 一天,细胞以每孔10,000‒40,000接种于 含有完全生长培养基的384-孔微孔板中。 第二天,使用浓度范围从15 nM到33 µM 的碳酰胆碱刺激细胞(刺激缓冲液包含用于 准备碳酰胆碱浓度的氯化锂溶液)。刺激一 小时后,IP1-d2偶联物、裂解缓冲液和抗 -IP1抗体-穴状化合物添加于孔中。细胞阴 性质控包含接受了抗-IP1抗体-穴状化合 物、偶联物和不含IP1-d2的裂解缓冲液的 未处理细胞。最终测定体积为40 µL,但是 此cAMP测定可针对不同的微孔板类型调 整体积。
根据IP-One HTRF产品说明书所述在刺激 缓冲液中溶解IP1标准品,使IP1标准品终 浓度范围从21.5到22,000 nM 4。孵育阳性 IP1和不含IP1的阴性质控。IP1-d2添加于 所有标准品和阳性IP1质控中,而接受了 偶联物的阴性质控和裂解缓冲液不含 IP1-d2。抗-IP1抗体抗体-穴状化合物添加 于所有样品中。室温孵育一小时后,根据 表1中的设置在SpectraMax M5e读板机上 进行微孔板读数。
Time Resolved
Delay: 50
Integration: 400
Top Read
| Table | ||
|---|---|---|
| Ex | Em | Cutoff |
| 314 | 620 | 570 |
| 314 | 668 | 630 |
Readings: 100
PMT: Auto
表 1 SpectraMax M5e读板机仪器设置。
数据分析
根据Cisbio的指南使用SoftMax® Pro软件 对cAMP和IP-One进行数据分析。 SoftMax Pro软件中的4个不同的HTRF预 设实验模板专为各种现阶段可用类型的 HTRF测定设计以简化数据采集和分析。
FRET 计算如下:
比值=(信号665 nm/信号620 nm) x 10000
Delta 比值=标准品或样品比值 - 比值neg
(比值neg 为阴性质控的比值)
Delta F%=(Delta比值/比值neg) x 100
仪器设置
波长、延迟和整合设置都已针对基于双单 色器的SpectraMax M5e读板机进行了优 化。尤其注意,XL665/d2的最佳发射波长 为668nm而非HTRF产品信息中所说的 665nm。
结果
最佳结果来自基于细胞的cAMP测定,其 使用384-孔微孔板并以每孔大约4,000 CHO-M1细胞接种(40 µL检测终体积)。最 优细胞密度根据细胞类型和特定测定条件 可能改变。用福斯高林处理细胞一小时 后,获得关于EC50为11.4 µM和Z’因子为 0.86的剂量应答曲线(图1)。使用Cisbio比 值方程计算的Delta F%值范围从47到707 (表2),与观察到的cAMP标准曲线(图2, 表3)相似。
***图 1 基于细胞的cAMP测定。*CHO-M1中福斯高林剂量应答曲线 (Z’=0.86, EC50=11.4 µM)。
表 2 基于细胞测定的数据总结。
***图 2 cAMP标准曲线。*cAMP标准曲线 (Z’=0.84, EC50=6.3 nM, 与产品说明书中给的值比较)。
表 3 cAMP dynamic 2测定标准曲线数据总结。
在基于细胞的IP-One测定中,优化的细胞 密度为384-孔微孔板每孔10,000个 CHO-M1细胞(40 µL最终测定体积)。碳酰 胆碱刺激一小时得到的EC50为0.64 µM和 Z’因子为0.91的剂量应答曲线(图3)。使用 Cisbio比值方程计算的Delta F%值范围从 3402到12539(表4)。
***图 3 基于细胞的IP1测定。*CHO-M1细胞中碳酰胆碱剂量应答曲线(Z’=0.91, EC50=0.64 µM 碳酰 胆碱)。
表 4 基于细胞测定的IP-One数据总结。
根据IP-One HTRF产品说明书直接准备的 IP1标准品生成的校准曲线其Z’因子为 0.84(图4)且Delta F%值范围从820到11883 (表5)。
***图 4 IP1标准曲线。*Z’=0.84, EC50=501 nM, 与产品说明书中给的值比较。
表 5 IP-one标准曲线数据总结。
总结
具有HTRF认证的SpectraMax M5e多功能 微孔板读板机多功能微孔板读板机提升了 双单色器系统和多模式检测功能灵活性, 扩展了研究者们的检测方法范围。当在 SpectraMax M5e读板机上运行IP-One和 cAMP HTRF测定时,展示了非常宽的动态 范围和范围从0.78到0.91的完美Z’因子。 使用SoftMax Pro软件的预设HTRF实验模 板大大简化了数据分析。
参考
- TR-FRET Basics (HTRF Technology)
- Zhang, J. H., Chung, T. D. Y., and Oldenburg, K. R. (1999). A simple statistical parameter for use in evaluation and validation of high throughput screening assays. J. Biomol Scrn 4(2): 67-73.
- cAMP dynamic 2 HTRF kit package insert (Cisbio international, France).
- IP-One HTRF kit package insert (Cisbio international, France).
Learn more about SpectraMax M Series Multi-Mode Microplate Readers >>